Summary
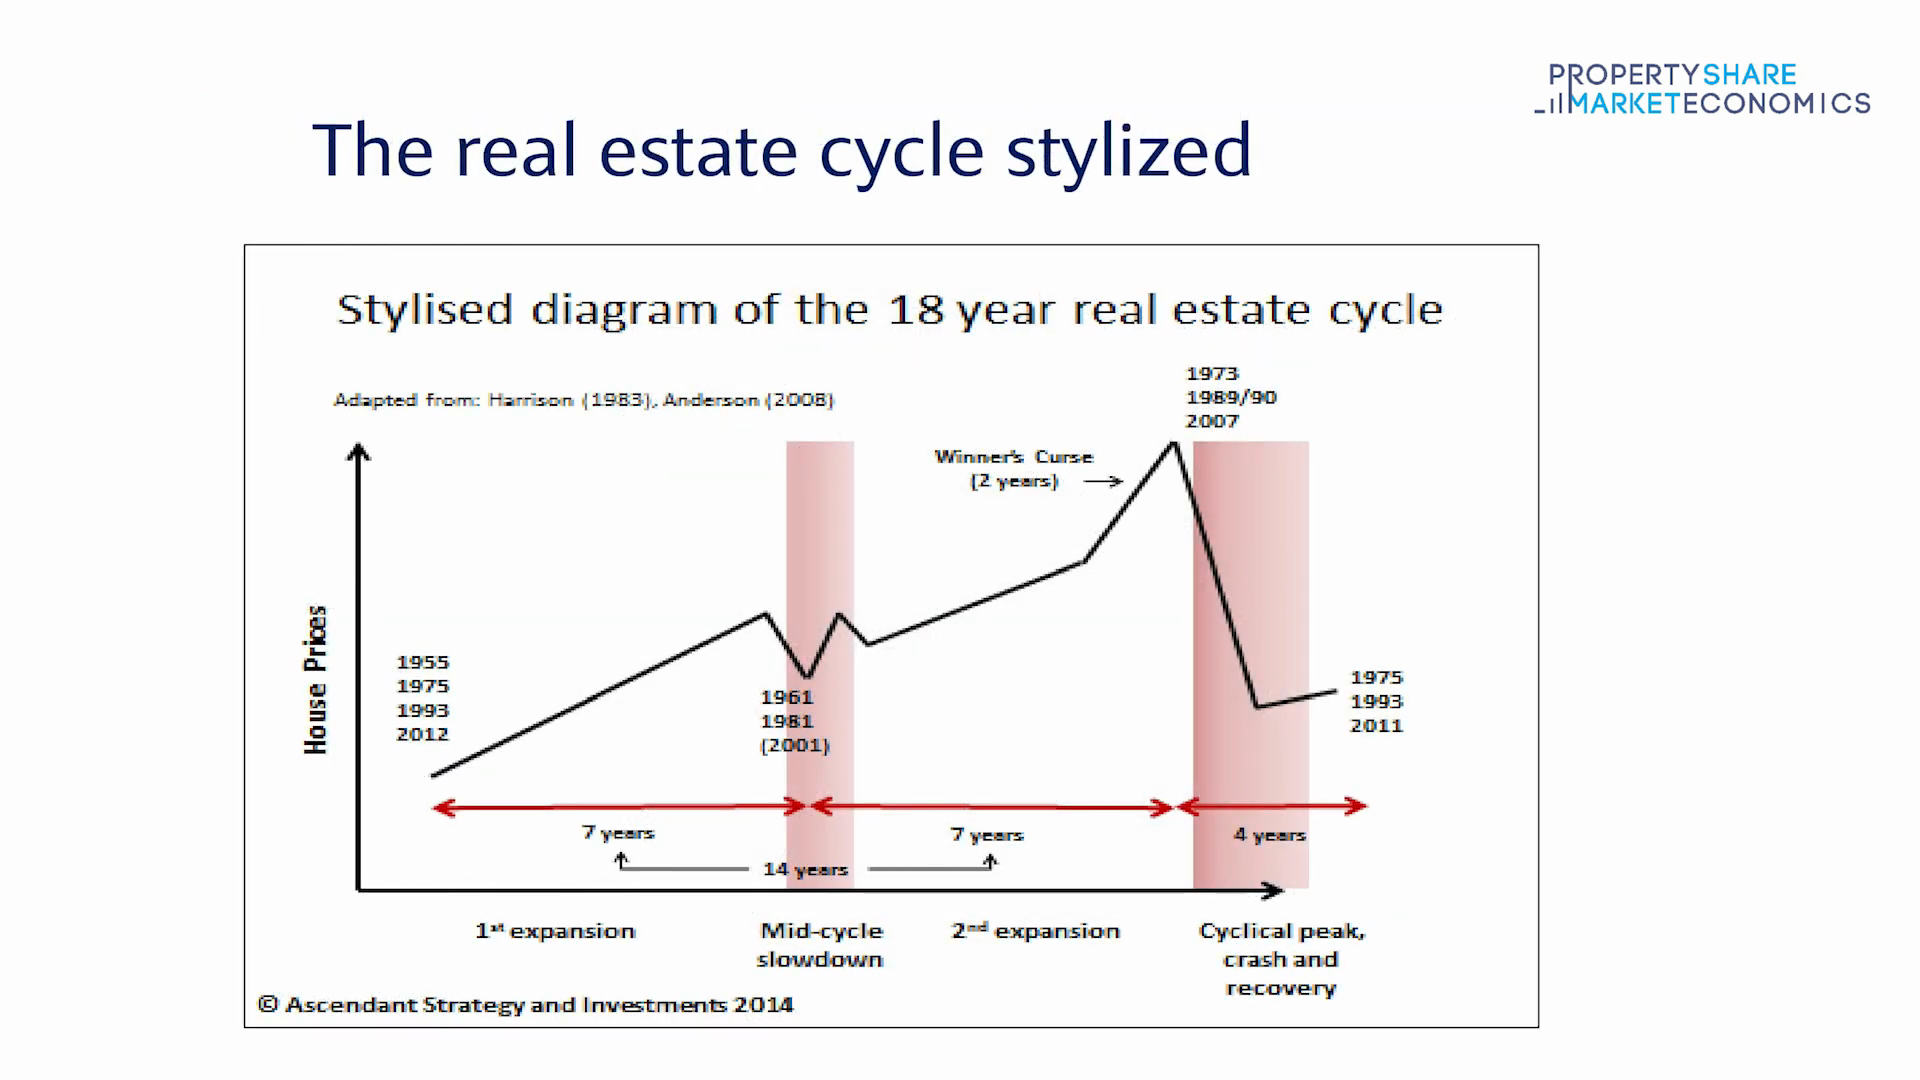
The 18.6-year real estate cycle describes a pattern where land prices rise for approximately 14 years, then fall for approximately 4 years, driven by the enclosure of economic rent capitalised into land prices, amplified by the banking system’s willingness to lend against rising collateral. Each downswing is accompanied by a major stock market crash: the four most recent end-of-cycle bear markets averaged a peak-to-trough S&P 500 decline of roughly 50–60% — 1929: ~−86%; 1973–74: ~−48%; 2000–02: ~−49% S&P / ~−78% Nasdaq; 2007–09: ~−57% [Source: standard market-history references — Yardeni Research, S&P, Robert Shiller dataset]. The cycle’s intellectual lineage spans nearly a century.
The empirical foundation was laid by Homer Hoyt (1933), whose University of Chicago dissertation documented land-price peaks in Chicago at approximately 18-year intervals stretching back to 1836. The theoretical roots lie in Henry George’s classical political economy and the work of Mason Gaffney, who demonstrated the cycle’s persistence across 800 years of Western economic history and identified land taxation as the structural remedy. Fred Harrison (The Power in the Land, 1983) proved the cycle survived World War II — which Hoyt had erroneously declared killed it — and predicted the 1990 bust and the general trajectory of crises through 2026. Fred Foldvary (AJES, 1997) synthesised the Georgist land cycle with Austrian capital theory and predicted, eleven years early, that the next depression would arrive “around 2008” — confirmed. Phil Anderson (The Secret Life of Real Estate and Banking, 2008) traced the cycle through 200 years of US history, identified consistent leading and lagging indicators in each cycle, and provided the investment framework central to applied cycle analysis. Akhil Patel (Secret Wealth Advantage, 2026) and Josh Ryan-Collins (Rethinking Land and Housing, 2017) have extended the work — Patel applying it to Australia and global equity markets, Ryan-Collins documenting the credit-channel mechanism in post-war UK data.
Property Share Market Economics (PSE) is the most recent practitioner using this 90+ year empirical tradition as a working investment advisory service. PSE applies the cycle alongside the Financial Timetable, Gann analysis, and real-time subscriber commentary to time entries and exits across asset classes.
An adjacent tradition — W.D. Gann’s early-20th-century work — was developed explicitly for investors as a market-timing framework, using planetary cycles, time/price geometry, and seasonal counts to call tops and bottoms. Though built from a different foundation than land economics, Gann’s long-cycle calls largely align with the 18.6-year framework, and PSE integrates both in its trading signals. See w-d-gann and gann-time-counts.
The root cause of the cycle is not interest rates, oil shocks, or political events — those are symptoms. The cause is the accumulation of economic rent absorbed into land prices until credit becomes unsustainable, then collapses. The cycle is plausibly tied to the lunar nodal cycle (~18.6 years), which correlates with speculative periodicity. The current cycle started its upswing from the 2012 lows; PSE projects a peak in the 2026–2028 window. As of May 26, 2026, Phil Anderson has declared “the beginning of the end” — no specific date given (“months, maybe even a year”) but the cycle-end condition is explicitly confirmed. [Source: PSE Sub #26, 2026-05-26]
Core Claims
- 2026-05-11-book-launch-fred-harrisons-cheating (2026-05-11): Fred Harrison predicts five major crises (political gridlock, environmental collapse, mass migration, authoritarianism, and uncontrolled artificial intelligence) are set to clash around 2028, requiring tax reform. — confidence: medium
- 2026-01-07-roadmap-2026-available (2026-01-07): 2026 Roadmap published; the 1966 “odd-man-out” Dow shape must be accounted for. — confidence: high
- 2026-01-21-trump-running-hot (2026-01-21): “Markets can’t top until we’re all-in. All the cash has to be gone.” — confidence: high
- 2026-02-02-bird-flu-timing (2026-02-02): “14 up, 4 down” — current cycle structure stated explicitly. — confidence: high
- 2026-02-16-bitcoin-crash-end-of-cycle (2026-02-16): “This is how real estate cycles end – in tight money conditions and rising longer-term rates.” — confidence: high
- 2026-03-02-roadmap-cycle-update-february (2026-03-02): “The underlying driver is the peaking of the land cycle, 14 years after it had its lows.” — confidence: high
- 2026-03-05-canary-credit-coalmine (2026-03-05): “The end is almost here” — private credit collapse beginning. — confidence: high
- 2026-03-10-banks-ayandeh (2026-03-10): Rising interest rates are the effect, not the cause — the cause is land prices too high. — confidence: high
- 2026-03-31-roadmap-update-march (2026-03-31): Phil Anderson: cycle top NOT yet reached as of March 2026. — confidence: high
- 2026-05-26-pse-sub-26-beginning-of-the-end (2026-05-26): “I think this is the beginning of the end.” Anderson’s most direct cycle-end declaration on record. Cites 14 years of confirmed US land price appreciation, AI/data center debt mirroring 2006 peripheral land rush, 30-yr yield confirming above 5%, and African sovereign debt stress as simultaneous late-cycle signals. Does not give a specific peak date: “it could take months, maybe even a year.” [Source: PSE Sub #26, 2026-05-26] — confidence: high
- hoyt-cyclical-fluctuations-1947 (1947): Homer Hoyt’s post-war retrospective confirms Chicago land peaks at 1836 / 1856 / 1872 / 1890 / 1925 at ~18-year intervals; warns lending institutions the pattern may repeat. — confidence: high [Source: Hoyt, 1947]
- foldvary-depression-of-2008 (1997): “The next major bust, 18 years after the 1990 downturn, will be around 2008” — written 1997, published AJES. Confirmed ✅ [Source: Foldvary, 1997]
- 2022-2023-phils-archives-external-interviews (2022): Anderson to Jason Pizzino: “It’s impossible to have a recession this year [2022]” — confirmed ✅; “The second half of the cycle is going to be prodigious” — confirmed ✅; SVB March 2023 correctly called as non-systemic ✅; GOKO 2023: “the upcoming crash in 2026-2027” ⏳ [Source: Phil’s Archives batch, 2022-2023] — confidence: high
- gaffney-role-of-land-markets-2009 (2009): “The cycle has persisted over the last 800 years. Major wars and plagues have broken the rhythm, but the cycle has persisted.” — confidence: high [Source: Gaffney, AJES, 2009]
- harrison-power-in-the-land-hoyt-heist (1983): Harrison proves the cycle was alive in post-WWII period by analysing Hoyt’s own land deals; introduces REITs as a new cycle-amplifying vehicle. — confidence: high
- 2026-04-23-boom-bust-house-prices-banking-depression-of-2010-fred-harrison (2026-04-23): Full Boom Bust (Harrison 2005/2010) — 18-year cycle traced through centuries; 2026 predicted as “even more painful bust”; criticises Greenspan/Brown for monetary myopia over structural land cause. [Source: pse-archive/Books, 2026-04-23]
- ryan-collins-rethinking-land-housing-ch1 (2017): UK land prices rose 15× since WWII vs. house structures 5×; three UK boom-busts correspond exactly to credit liberalisations. [Source: Ryan-Collins et al., 2017]
- harrison-moneyweek-2026-interview-2022 (2022): Harrison predicts 2026 peak — “It will be in 2026, that is at the end of a 14-year cycle in house prices within a business cycle of 18 years.” ⏳ PENDING (paywalled)
- 2026-05-15-the-land-trap-mike-bird (2025): Bird (financial journalist, mainstream framing) documents that land boom-bust cycles driven by the land-credit feedback loop are a recurring pattern across all modern economies — but does NOT commit to 18.6-year periodicity. Confirms the core mechanism: land as collateral → credit amplification → bust. Documents Japan (Land Standard, 1989–2004), 2008, and China as three major examples of the same pattern. — confidence: high [Source: Bird, The Land Trap, 2025]
Mechanism / How It Works
The fundamental engine is economic rent — the surplus value created by location and community investment — being captured by landowners rather than returned to the public. This produces a self-reinforcing credit-land feedback loop:
- Land prices rise as the economy expands — all productivity gains get absorbed as higher rent capitalised into land prices, not into wages or production
- Banks amplify by lending against rising land collateral, creating a feedback loop between credit and land values
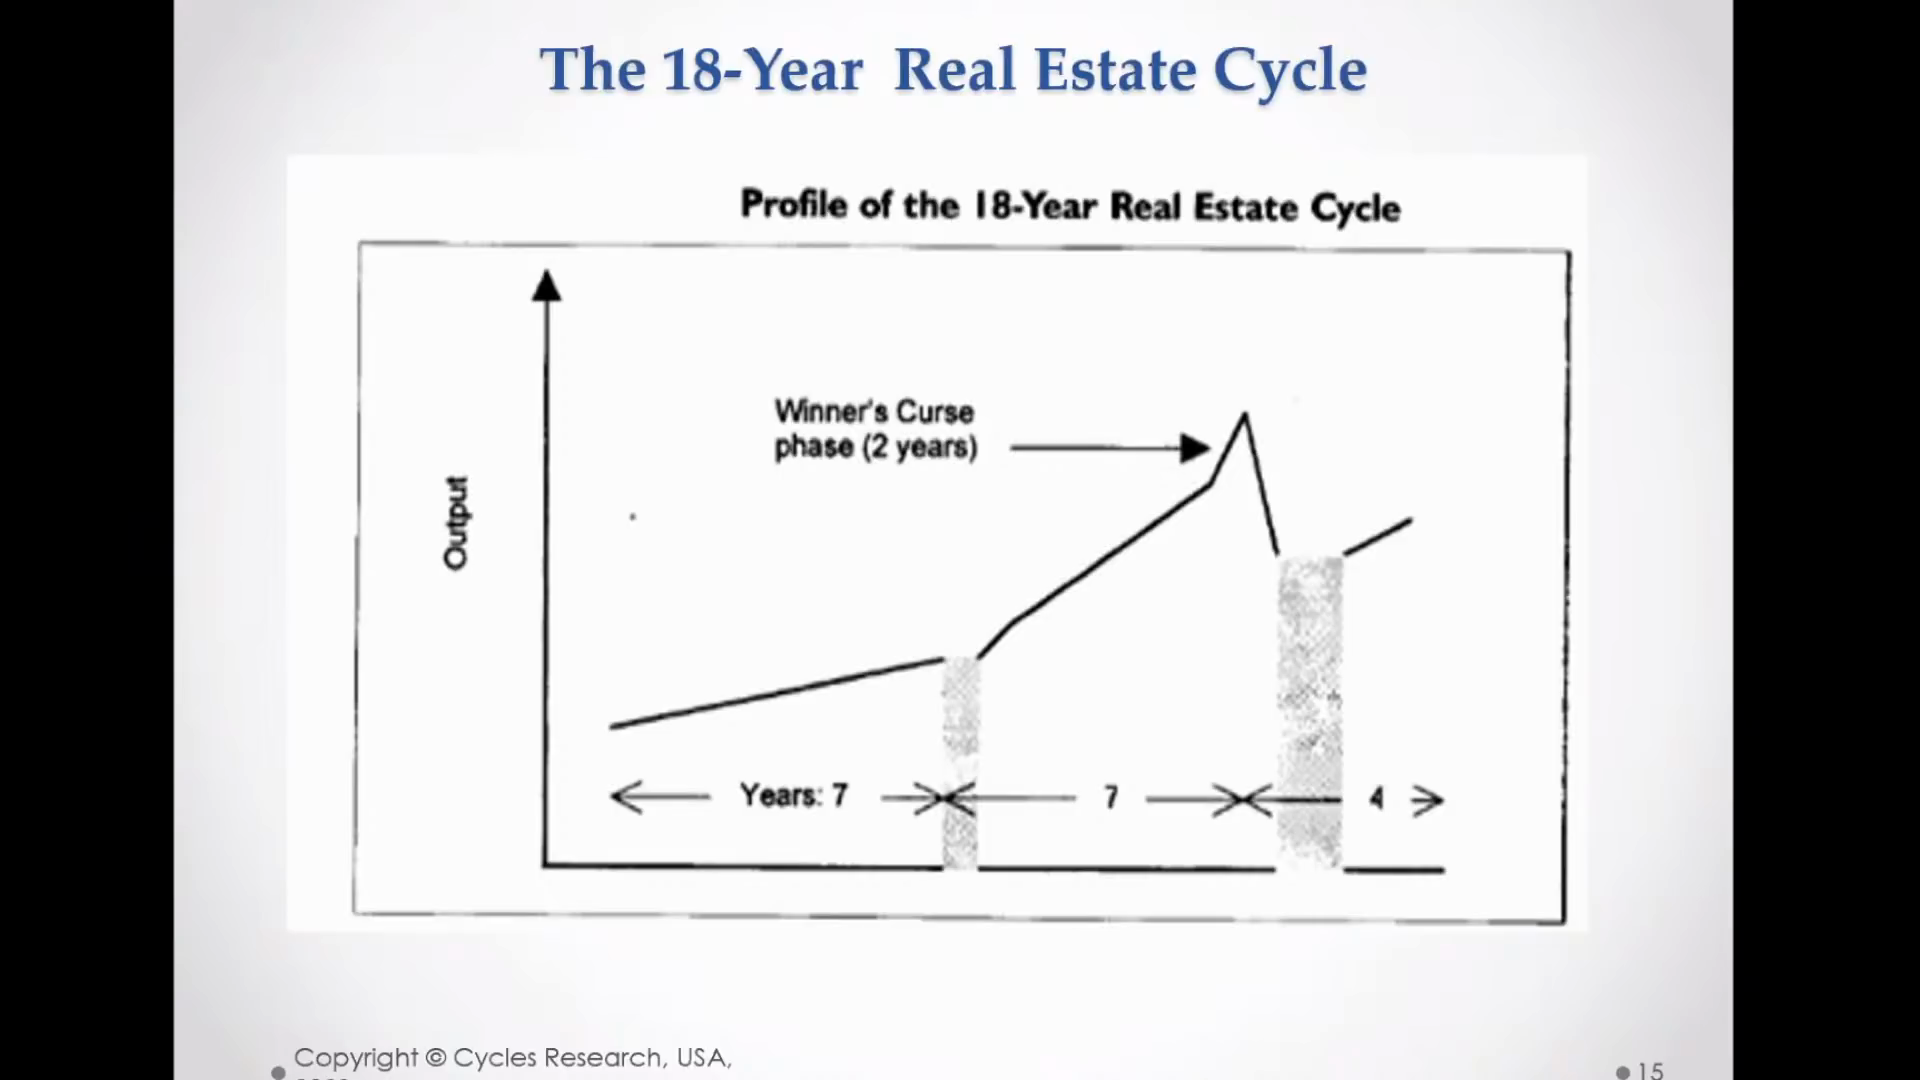
- Speculation intensifies in the “Winners Curse” final phase — everyone is “all-in”; markets can’t top until all cash is deployed
- Rising interest rates become unsustainable against inflated land values — they are the effect, not the cause
- Credit contraction begins; land prices fall; bankruptcies cascade
- ~4-year downturn (debt deflation, banking stress, social strain)
- Lows reset the foundation for the next 14-year upswing
Land-credit feedback (modern amplifier): Ryan-Collins et al. (2017) document that bank mortgage credit, not just speculative appetite, is the primary mechanism in the post-1970 period. UK land values rose 15× since WWII vs. house structures 5×; three UK boom-busts correspond exactly to credit liberalisations:
- 1972–74: 1971 Competition and Credit Control deregulation → mortgage lending surge → peak 1973 → crash 1974
- 1988–92: Thatcher-era building-society deregulation; 95%+ LTV mortgages appeared; peak 1988 → crash through 1992
- 2005–08: Basel II 50% risk weight on mortgages + RMBS securitisation → global peak 2007 → crash through 2008–09
Everyone with a mortgage is a land speculator: Gaffney (2007) identifies sprawl + credit as the structural mechanism; ordinary homebuyers are inadvertently locked into land speculation through mortgage leverage [Source: Gaffney, 2007].
Structural vs. credit-driven tension: Ryan-Collins’s methodological position is that the 18-year cycle is credit-driven, not structurally baked-in — pre-credit-deregulation periods (1945–1970) showed suppressed cycles. Harrison, Anderson, and Foldvary treat the cycle as structural across centuries. Both can be true: the 18-year period may be an intrinsic land-speculation rhythm that was suppressed by capital controls and reactivated post-1970 by credit liberalisation. See also the Contradictions & Open Questions section below.
Bird’s Land-Led Growth and Downturn Mechanism (Mainstream Cross-Check)
Mike Bird (The Land Trap, 2025) provides a mainstream corroboration of the credit-land cycle from outside the Georgist/PSE tradition. His framing aligns with the core mechanism but diverges on periodicity and root cause:
How land prices crowd out productive investment (Bird’s distinctive contribution): Bird documents empirically that land booms cause economic damage during the boom, not just at the crash:
- Land-rich firms (older, more established, less profitable) gain collateral-backed access to credit
- Land-poor firms (younger, more innovative, more productive) are crowded out of borrowing
- A 10% rise in real estate prices boosts investment by land-rich firms but reduces investment by land-poor firms — the economy misallocates capital in real time (Banque de France research cited by Bird)
- Sebastian Doerr (BIS): when real estate prices exploded 1993–2008, the additional borrowing by unprofitable companies was large enough to drag down productivity of entire sectors
- This “invisible tax” on innovation is Bird’s most distinctive contribution — it explains why economies grow more slowly during prolonged land booms, even before the crash [Source: Bird, The Land Trap, 2025, Ch. 6]
How land collateral drives credit cycles:
Bird documents the Japan case as the archetype. Japan’s economy operated on tochi hon’isei (“Land Standard”) — the economy was pegged to land values the way currencies were once pegged to gold. Rising land → more collateral → more borrowing → reinvestment in land → prices rise further. When land peaked and fell >80% in urban cores, the feedback ran in reverse: falling collateral → bank losses → credit contraction → companies focused on debt repayment → GDP growth collapsed from 4% (1980s) to 0.5%/yr (2000s). Cumulative land capital loss 1989–2004: one quadrillion yen ($8 trillion USD). [Source: Bird, The Land Trap, 2025, Ch. 7]
How land speculation produces downturns: Bird’s 2008 framing: “A relatively modest disruption to the trend — not even a drop, but just a stall in prices — was enough to upturn the mountain of debt that had boomed in the previous years.” The critical insight is that the perception of land as safe collateral creates over-leverage — and the same perceived safety is what makes the collapse devastating when it arrives. [Source: Bird, The Land Trap, 2025, Ch. 6]
Does Bird endorse the 18.6-year periodicity? Bird does not commit to 18.6 years. He treats land cycles as recurring and cites Fred Foldvary’s land-cycle work (index, p. 55; Ch. 4 footnote) but does not engage with Harrison’s precise periodicity claim. His framing is of a general recurrence driven by credit and collateral dynamics, without a fixed period. This is an important distinction: Bird’s framework is compatible with the 18-year period but does not independently confirm it. His value is as cross-check corroboration of the mechanism, not the timing.
Stock Market Crash vs. Housing Crash — How They Relate
A persistent source of confusion in interpreting the 18.6-year cycle is that readers conflate two distinct events: the housing market crash and the stock market crash. They are linked by credit, but they are not the same event, do not occur simultaneously, and do not always match in severity.
Why the stock market crashes at cycle-end
The equity peak is driven by the same credit-land feedback loop described in the Mechanism section above, but working through a different channel. As the land cycle peaks:
- Banks holding inflated real-estate collateral begin to retrench lending. As Harrison documents in Boom Bust, the banking system’s withdrawal from mortgage credit removes the liquidity that has been supporting all asset prices, not just land [Source: Harrison, Boom Bust, 2005/2010].
- Leveraged equity speculation — funded by the same cheap credit that inflated land — unwinds as collateral values fall and margin calls are triggered [Source: Phil Anderson, PSE, 2022].
- The household wealth effect reverses: as land and property values fall, consumer spending contracts, corporate earnings fall, and equity markets follow.
- Foldvary’s Geo-Austrian synthesis identifies the moment of maximum fragility: when the Fed faces a choice between controlling inflation and preventing recession at the cycle top, it “is now powerless to stop both” — the reversal becomes self-reinforcing [Source: Foldvary, The Depression of 2008, 2007].
When the stock market crashes relative to real estate
The critical distinction, documented across multiple cycles, is that the equity peak typically lags the residential real estate peak by one to three years. Land and housing prices turn down first; equities continue rising for a further period as market participants interpret the real estate weakness as temporary. This lag is documented in cycle-by-cycle evidence:
| Cycle | RE Peak | Equity Peak | Lag | Magnitude (equity trough) | Sources |
|---|---|---|---|---|---|
| 1920s | 1925–26 (Florida/urban US) | Sept 1929 (Dow) | ~3 years | −89% (Dow, 1929–32) | Hoyt 1933; Harrison 1983; Gann 1928 forecast |
| 1988–90 | 1988–89 (UK/US) | ~Aug 1990 (recession) | ~11 months | Moderate (−20%) | PSE Special Report 14 Years Up — “Stock market peaked 11 months after property” [Source: PSE, 14 Years Up] |
| 2005–08 | Sept 2006 (raw land — Anderson EIS forecast) / Feb 2007 (Case-Shiller National Home Price Index peak: 184.596) | Oct 9, 2007 (S&P 500 close 1,565.15) | ~8 months (housing index → S&P) / ~13 months (Anderson’s leading indicator → S&P) | −57% (S&P 500, 2007–09) | Anderson EIS Sept 2006 ✅; Foldvary 1997 (predicted); Harrison 2005 (predicted); Ryan-Collins 2017; FRED CSUSHPISA. See 2006-2007-real-estate-cycle-peak-reconciliation. |
| 2026–28 (forecast) | 2026–28 (projected) | 2027–29? | TBD | TBD ⏳ | PSE 2026 Roadmap; Anderson March 2026 |
Akhil Patel’s 2022 analysis of second-half stock market gains across three prior cycles (1962–73, 1982–90, 2002–2007) shows that major indices typically doubled or more from mid-cycle low to the final peak — and explicitly flags the 1920s “Jazz Age” analog where equities continued rising past the 1926 land peak all the way to September 1929, a full three years later [Source: Akhil Patel, PSE, June 2022].
How much does the stock market crash
The magnitude of the equity crash depends on whether the cycle termination coincides with a full land-credit collapse (end-of-cycle) or merely a mid-cycle recession (which does not terminate the land cycle):
- End-of-cycle (land-cycle termination) crashes are characterised by banking stress and a multi-year unwinding:
- 1929–32: −89% (Dow Jones Industrial Average). The 1925–26 land peak preceded the crash by 3+ years; the gap was filled by pure equity speculation and consumer credit expansion. The banking collapse that followed was catastrophic precisely because it coincided with the full land-cycle trough [Source: Hoyt, 1933; Harrison, 1983].
- 2007–09: −57% (S&P 500). The US land/raw-land peak was called by Anderson in his September 2006 EIS forecast (“Raw land rush in the US; indicates US real estate peak has arrived”); the Case-Shiller National Home Price Index confirmed the headline housing peak at 184.596 in February 2007; the S&P 500 peaked October 9, 2007 at 1,565.15, an ~8-month lag from the Case-Shiller peak (~13 months from Anderson’s call). The equity crash was transmitted through mortgage-backed securities and bank balance-sheet impairment [Source: Anderson, Secret Life of Real Estate and Banking, 2008, Ch. 1 Note 8; FRED CSUSHPISA; Foldvary, 2007; Harrison, 2005; Ryan-Collins, 2017]. See 2006-2007-real-estate-cycle-peak-reconciliation for the full triangulation.
- Mid-cycle crashes (dot-com 2000–02: −49% on S&P 500) do NOT represent land-cycle terminations. The 2000–02 crash was a speculative technology bubble unwinding within a still-expanding real estate cycle; US land prices continued rising through 2006. This distinction is critical: a severe equity crash does not always signal land-cycle termination [Source: Phil Anderson, PSE; Foldvary, 2007].
The two crashes are not the same event
- Housing crash: a multi-year, drawn-out decline in residential land and home prices — typically 4+ years to fully trough. Slow-moving, driven by credit contraction and oversupply working through gradually.
- Stock market crash: typically a sharp 12–18 month event, faster and more visible. Driven by leveraged speculation unwinding and confidence collapse.
The two are causally linked through the credit channel, but their timing and severity can diverge significantly. Some cycle terminations produce severe housing declines with moderate equity damage (UK 1990); others produce moderate housing corrections with severe equity crashes (Japan 1990s). The 2008–09 episode was unusual in producing severe damage to both simultaneously.
For the current cycle, PSE’s working thesis (as of early 2026) is that equities may continue to rise past the residential real estate peak — the “Jazz Age” scenario — before the eventual equity top, which Anderson has not yet confirmed as of March 2026 [Source: PSE, March 2026 Roadmap update].
Key Evidence
Primary empirical foundation — Homer Hoyt (1836–1925): Chicago land-price peaks from Hoyt’s own research: 1836 / 1856 / 1872 / 1890 / 1925 — each approximately 18 years apart. Hoyt’s 1933 dissertation is the primary empirical source for the modern cycle theory. Post-war (1947), Hoyt warned lending institutions the pattern may repeat [Source: Hoyt, 1947]. Harrison’s Power in the Land (1983) subsequently proved the cycle remained alive by analysing Hoyt’s own post-war land investment deals — Hoyt’s claim that the cycle ended after WWII was contradicted by his own behaviour [Source: Harrison, 1983].
800-year persistence (Gaffney, 2009): Gaffney documents the cycle persisting across 800 years of Western economic history; only major wars and plagues have broken the rhythm [Source: Gaffney, AJES, 2009].
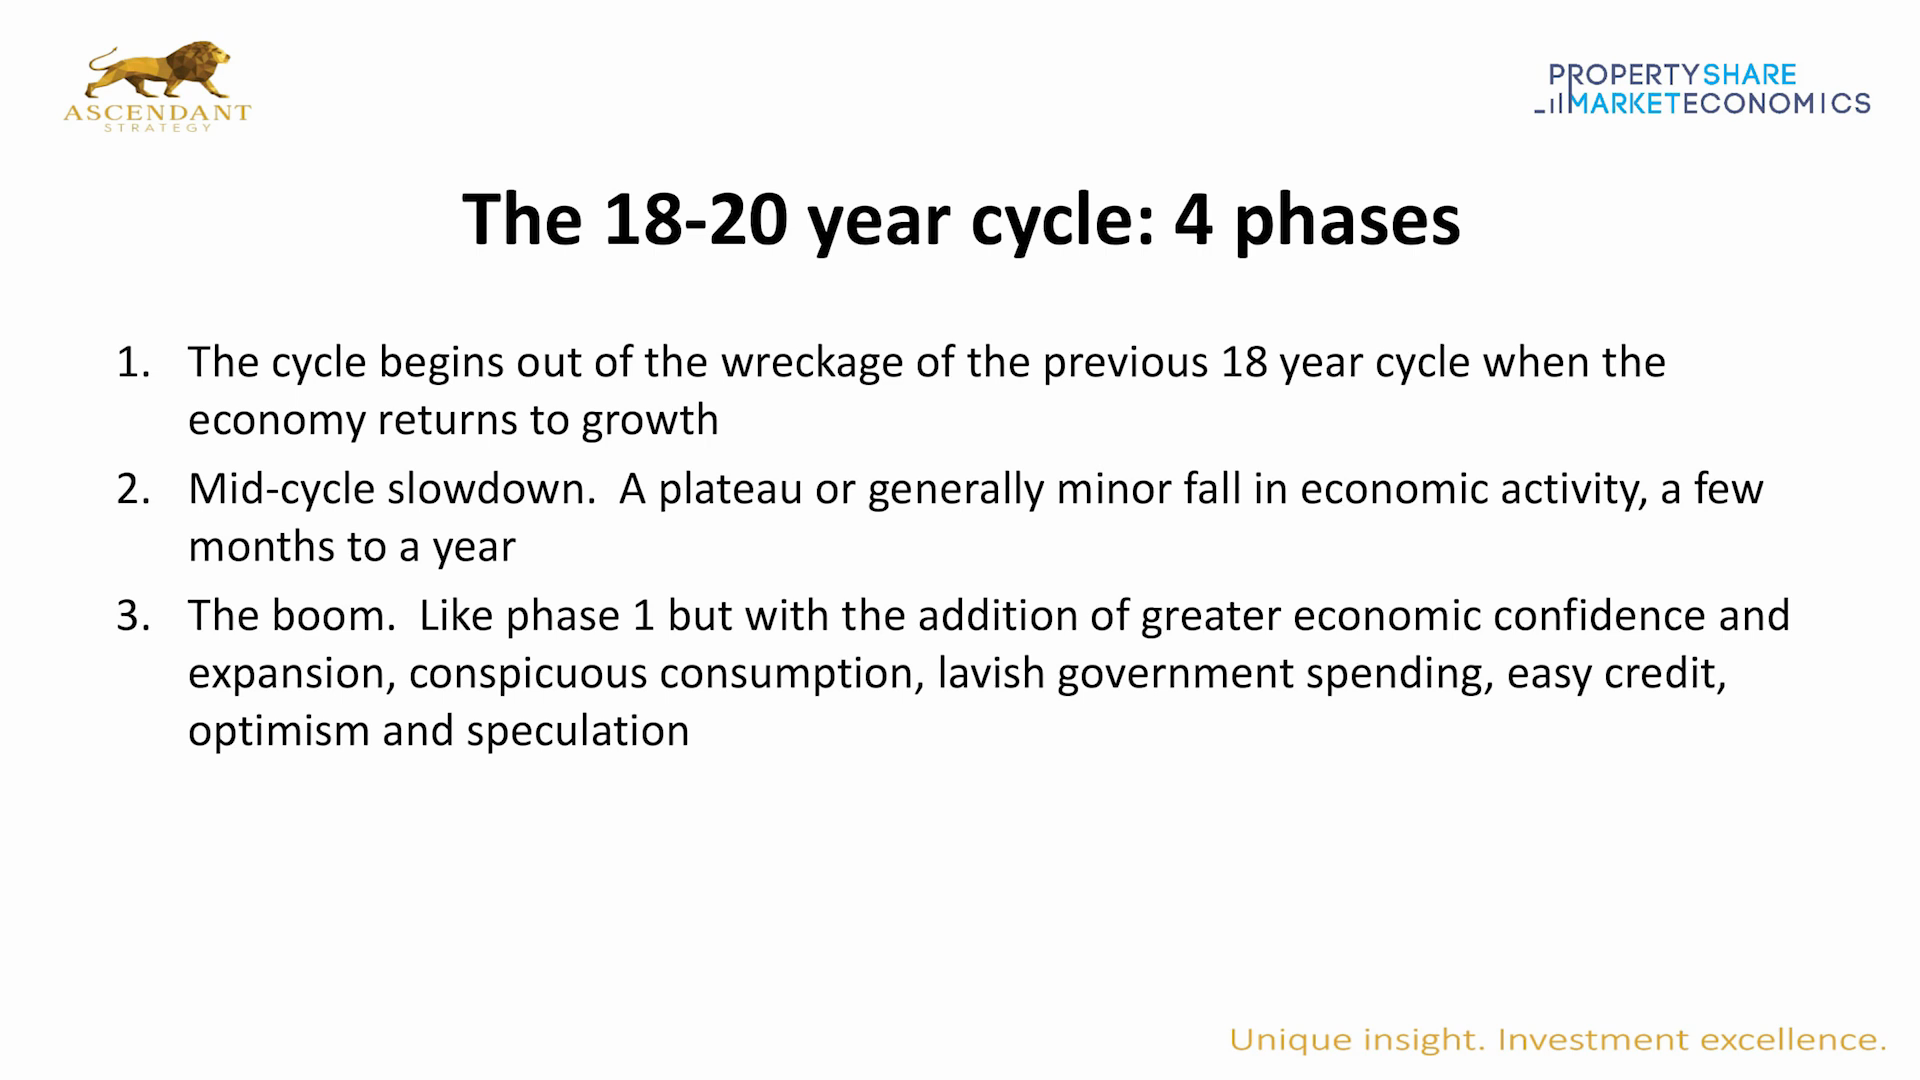
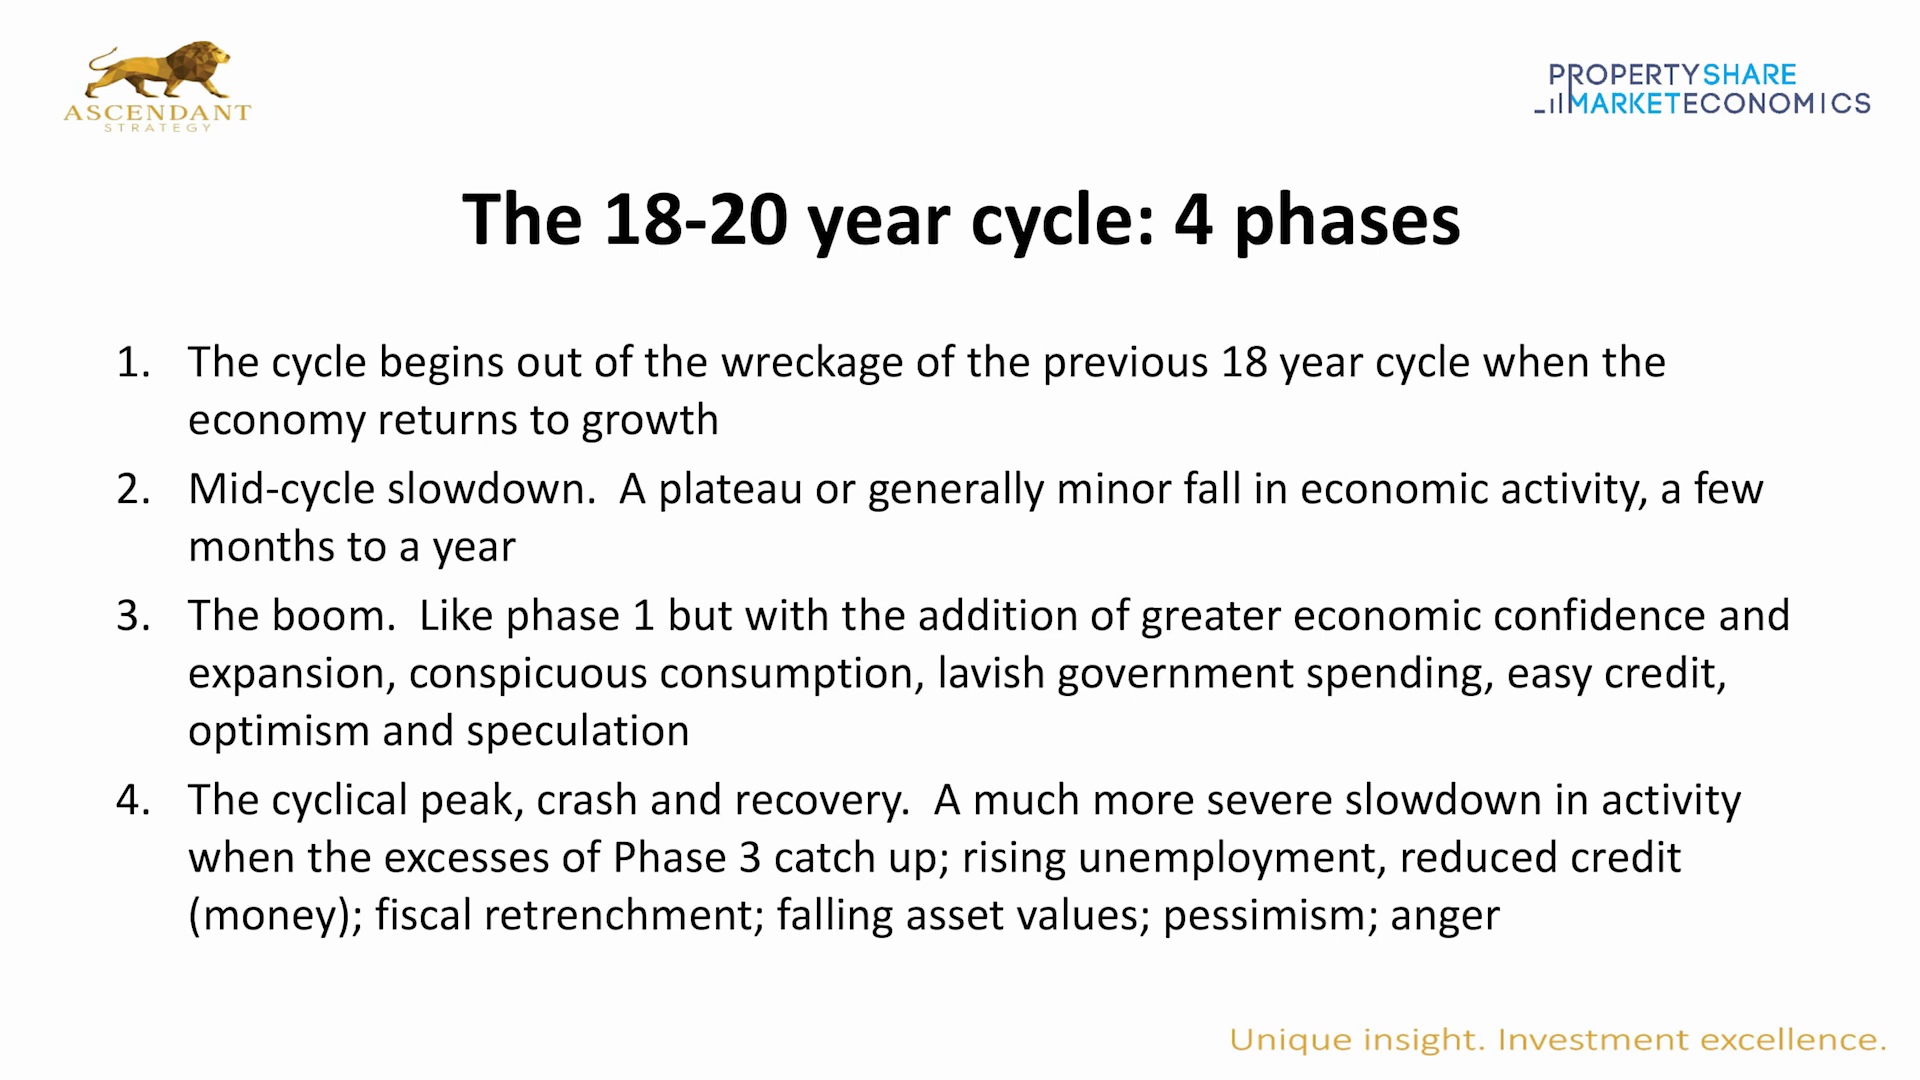
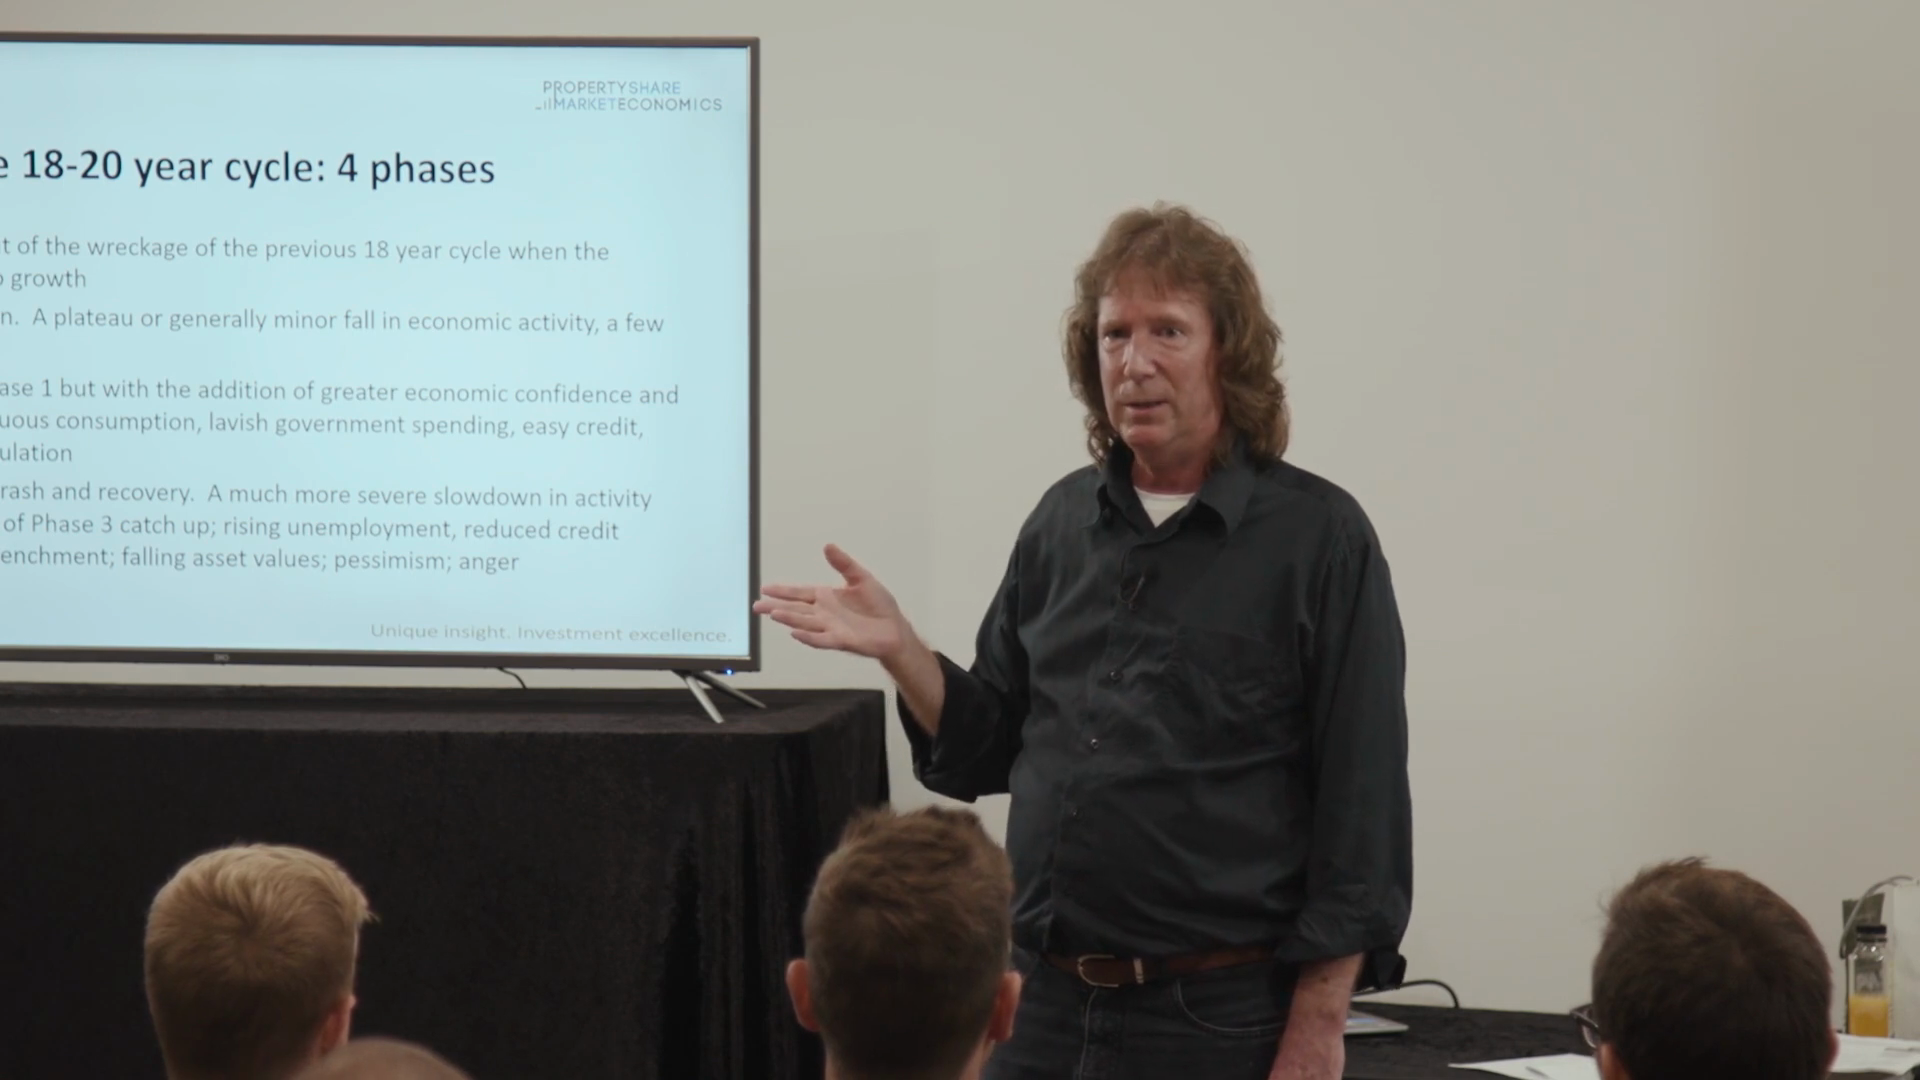 Four phases of the 18–20 year cycle — Recovery, Mid-Cycle Boom, Speculative Mania, Bust.
Source: 2022-10-01-bbi-gold-coast-session-part-2
Four phases of the 18–20 year cycle — Recovery, Mid-Cycle Boom, Speculative Mania, Bust.
Source: 2022-10-01-bbi-gold-coast-session-part-2
Modern cycle record (confirmed predictions):
| Cycle | Trough | Peak | Trough | Sources |
|---|---|---|---|---|
| Pre-war | — | 1925 | 1933 | Hoyt 1933/1947 |
| Post-war | 1945 | ~1955 | ~1958 | Harrison 1983 (Hoyt deals) |
| 1st post-deregulation | — | ~1973 | 1974 | Ryan-Collins 2017 |
| 2nd post-deregulation | — | ~1988–89 | 1990–92 | Ryan-Collins 2017; Harrison 1983/2005 |
| 3rd post-deregulation | 1990–92 | 2007–08 | 2011–12 | Foldvary 1997 (predicted); Harrison 2005 (predicted) ✅ |
| Current | 2012 | 2026–2028 | ~2030? | PSE 2026 Roadmap; Harrison 2022 (predicted) ⏳ |
Foldvary 1997 — precision prediction: Fred Foldvary published in 1997 (AJES) that the next bust would be “around 2008” — 18 years after 1990. The Depression of 2008 prediction was confirmed [Source: Foldvary 1997, 2009]. Foldvary (2015) confirmed the cycle was still on track; projected next depression around 2026 [Source: Foldvary, 2015].
Fred Harrison — multi-decade prediction record:
- The Power in the Land (1983): Predicted the 1990 bust and the general cycle pattern for the coming decades
- Boom Bust (2005): Predicted a “2010 depression” (off by 2 years on start, directionally confirmed ✅); projects 2026 as “even more painful bust”
- MoneyWeek (2022): “It will be in 2026, that is at the end of a 14-year cycle” ⏳
Current cycle (2012–present):
- Lows confirmed ~2011–12
- Bitcoin crash Oct 2025 (50% from ~$120k peak) — used by PSE as liquidity/cycle signal
- Blue Owl private credit crisis (Feb–Mar 2026) matches PSE’s “end of cycle” template
- PSE Clock reading: 3pm as of week of March 23, 2026 = “final frantic peak in real estate activity”
- Cycle top NOT confirmed as of March 31, 2026 (Phil Anderson); monitoring April rally as key signal
Harrison’s 2026 interview (~2023): 2026 peak, 2028 end; COVID accelerated rather than derailed; 2024–2026 = “final rocket” phase [Source: Harrison Ultimate Prediction, ~2023].
Australian market (Patel, 2024): Akhil Patel applies the PSE framework to Australia; structural supply shortage argument is raised by mainstream skeptics as a competing explanation for elevated prices (vs. cycle timing) [Source: Patel, 2024; Daily Mail Australia, 2026].
Applications
- Time entries and exits in all asset classes using cycle timing (land cycle leads all other markets)
- Use homebuilder ETFs as leading indicators for cycle stage
- Monitor private credit/shadow banking for early warning signs (Blue Owl, 2026 = template)
- Watch bond yields: rising long-term yields signal end-of-cycle (effect, not cause)
- Use Dow/Nasdaq divergence to read cycle stage
- PSE Clock (clockface metaphor): current reading = 3pm (final frenetic phase approaching noon/peak)
- Gaffney’s policy implication: land value tax (LVT) is the structural remedy that would dampen or eliminate the cycle by returning economic rent to the public [Source: Gaffney, 2009]
- Ryan-Collins additional levers: credit guidance (Werner 2003), tenure reform, planning reform, national accounting reform [Source: Ryan-Collins, 2017 Ch. 7]
Evolution Over Time
- 1933: Homer Hoyt documents Chicago peaks empirically in his dissertation — the primary empirical source
- 1947: Hoyt claims the cycle ended after WWII; begins investing in rising post-war land (contradicting his own claim)
- 1983: Fred Harrison publishes Power in the Land, proves cycle survived WWII, introduces REITs as cycle amplifier; predicts 1990 bust ✅
- 1997: Fred Foldvary publishes 2008 bust prediction (AJES) — 18 years from 1990 ✅
- 2005: Harrison’s Boom Bust — “2010 depression” prediction ✅ (off by ~2 years on start)
- 2009: Gaffney retrospective confirms cycle; Gaffney endorses Anderson’s book as “on the whole persuasive”; Foldvary retrospective confirms land-value collapse mechanism
- 2012: Georgist Journal panel (Gaffney/Harrison/Foldvary) surfaces key internal tension: “average not a law” (Foldvary) vs. “structural certainty” (Harrison); 1911 exception explained by property tax reform
- 2015: Foldvary update — cycle on track; next depression ~2026
- 2017: Ryan-Collins et al. introduce bank-credit-as-primary-mechanism thesis; UK post-WWII residential capitalism timeline; three boom-busts mapped to deregulation events
- 2022: Harrison MoneyWeek prediction — “2026, end of the 14-year cycle”
- 2026 (Jan–Mar): PSE live commentary — “14 up, 4 down”; cycle top not yet confirmed; April rally watched as key signal; PSE Clock at 3pm
- PSE Clock tool: introduced as clockface metaphor for cycle position; 3pm reading (March 2026) = approaching peak
Contradictions & Open Questions
- Structural vs. credit-driven: Harrison/Anderson/Foldvary treat the cycle as structurally baked-in over 800 years. Ryan-Collins argues it is credit-driven — pre-1970 periods with capital controls showed no clear 18-year cycle. Resolution: the cycle may be an intrinsic speculation rhythm suppressed by capital controls and reactivated by credit liberalisation post-1970. Neither side has fully resolved this. Bird adds: the cycle is clearly real and recurring (confirmed across Japan, 2008, China, US history), but Bird declines to specify the period — treating it as a structural vulnerability that manifests when credit and collateral dynamics align, not a fixed 18-year clock.
- Pre-WWII UK data: Mat Smith (Substack, 2024) argues UK pre-WWII data shows no 18-year cycle for 75+ years; nominal prices obscure the real pattern; real-terms data is more supportive but still imprecise [Source: Mat Smith, 2024]. This is a genuine empirical gap — pre-WWII UK data should be reviewed against the Harrison claim of 800-year persistence.
- 2026 timing uncertainty: Phil Anderson maintains cycle top not yet reached (March 2026), but markets already down ~10% from highs. Is 2026 an “up year” (2006 parallel) or “down year” (1966 parallel)? The April 2026 rally will be a key signal.
- Bitcoin signal ambiguity: Bitcoin crash Oct 2025 (50% from ~$120k peak) — does this indicate liquidity already peaked before the property cycle top? Or is this a mid-cycle shakeout with the real top still ahead?
- Open question: Has Gaffney’s 800-year persistence claim been directly verified in primary sources, or is it largely cited second-hand through Harrison? A direct audit of the Georgist journal sources would strengthen or qualify this claim.
Related Concepts
- Winners Curse Phase
- Financial Timetable
- Economic Rent
- 14-Up-4-Down
- Land Value Theory
- Credit Crisis
- Geo-Austrian Synthesis
- Hoyt Chicago Land Cycle
- Land-Credit Feedback Loop
- Property Tax as Cycle Stabilizer
- Homer Hoyt
- Fred Foldvary
- Mason Gaffney
Sources
Primary and key secondary sources:
- hoyt-cyclical-fluctuations-1947 — Homer Hoyt (1947), primary empirical source: 1836–1925 Chicago peak table
- foldvary-depression-of-2008 — Fred Foldvary (1997/2007), The Depression of 2008: 2008 prediction from 18-year interval ✅
- 2026-05-03-foldvary-depression-retrospective-2009 — Foldvary (2009) retrospective; land-value collapse mechanism confirmed
- 2026-05-03-foldvary-riding-upswing-2015 — Foldvary (2015): cycle on track; next depression ~2026
- gaffney-role-of-land-markets-2009 — Mason Gaffney (2009), AJES: 800-year persistence; 8-element cycle anatomy; LVT remedy
- 2026-05-03-gaffney-mechanism-henry-george — Gaffney (2007): sprawl + credit mechanism; everyone with a mortgage is a land speculator
- harrison-power-in-the-land-hoyt-heist — Fred Harrison (1983), Power in the Land: Hoyt Heist; post-WWII cycle evidence; REITs as amplifier
- 2026-04-23-boom-bust-house-prices-banking-depression-of-2010-fred-harrison — Harrison (2005/2010), Boom Bust: 2010 prediction ✅; 2026 next bust
- 2026-04-23-the-secret-life-of-real-estate-and-banking-phil-anderson — Phil Anderson, Secret Life of Real Estate and Banking: US cycle 1800–present; land-led recessions; credit amplifier
- ryan-collins-rethinking-land-housing-ch1 — Ryan-Collins et al. (2017), Rethinking Land and Housing: UK 15× land multiplier; three UK boom-busts = credit liberalisations
- 2026-04-23-power-in-the-land-fred-harrison — Harrison (1983) full book: historical evidence UK/US/Japan/Australia; 100% land rent tax as remedy
- gaffney-review-anderson-secret-life-2009 — Gaffney (2009): formal endorsement of Anderson’s book; same indicator sequence 1800–present
- georgist-journal-18yr-interview-2012 — Georgist Journal (2012) panel (Gaffney/Harrison/Foldvary): internal tensions; “average vs. structural”; 1911 exception
- 2026-05-03-mat-smith-substack-2024 — Mat Smith (2024): skeptical view; UK pre-WWII data gaps; nominal vs. real price distinction
- harrison-moneyweek-2026-interview-2022 — Harrison (2022): 2026 peak prediction ⏳ (paywalled)
- 2026-05-03-harrison-ultimate-prediction-transcript-2026 — Harrison (~2023): 2026 peak, 2028 end; COVID accelerated; “final rocket” 2024–2026
- 2026-04-23-boom-bust-house-prices-banking-depression-of-2010-fred-harrison — Harrison (2005/2010) full Boom Bust book
- 2026-04-23-power-in-the-land-fred-harrison — Harrison (1983) full Power in the Land book
- 2026-05-04-ryan-collins-rethinking-economics-land-housing — Ryan-Collins et al. full book (Ch. 4, 5, 7): residential capitalism timeline; three boom-busts; policy reform levers
- 2026-05-03-ryan-collins-bsp-lecture-transcript — Ryan-Collins (2019): 80% of house price changes = land values across 14 economies
- 2026-05-03-harrison-economic-meltdown-qa-transcript — Harrison (~2023): unearned rent mechanism; Georgist framework vs. libertarian critique
- 2026-05-03-harrison-daily-renter-2025 — Harrison (2025): Buffett exit from real estate cited as cycle-peak signal
- 2026-05-03-patel-atelier-wealth-2024 — Akhil Patel (2024): PSE framework for Australia; Patel’s origin story
- 2026-05-03-georgist-journal-18yr-2012 — Georgist Journal (2012): Gaffney/Harrison/Foldvary best internal debate
- 2026-05-03-effectiveagents-18yr-cycle-2026 — EffectiveAgents (2026): current market stats (Dec 2025); cycle timeline 1800–2026; regional variation
- 2026-05-03-harvard-extension-2022 — Harvard Extension (2022): four-phase model; three trouble indicators; Foldvary credibility anchor
- 2026-05-03-daily-mail-australia-2026 — Daily Mail Australia (2026): PSE Darren Wilson + mainstream skeptics; supply shortage vs. cycle timing
PSE subscriber emails (2026 cycle commentary):
- 2026-01-07-roadmap-2026-available, 2026-01-21-trump-running-hot, 2026-02-02-bird-flu-timing, 2026-02-16-bitcoin-crash-end-of-cycle, 2026-03-02-roadmap-cycle-update-february, 2026-03-05-canary-credit-coalmine, 2026-03-10-banks-ayandeh, 2026-03-31-roadmap-update-march
Full bibliographic index: 18-6-year-real-estate-cycle
More Charts
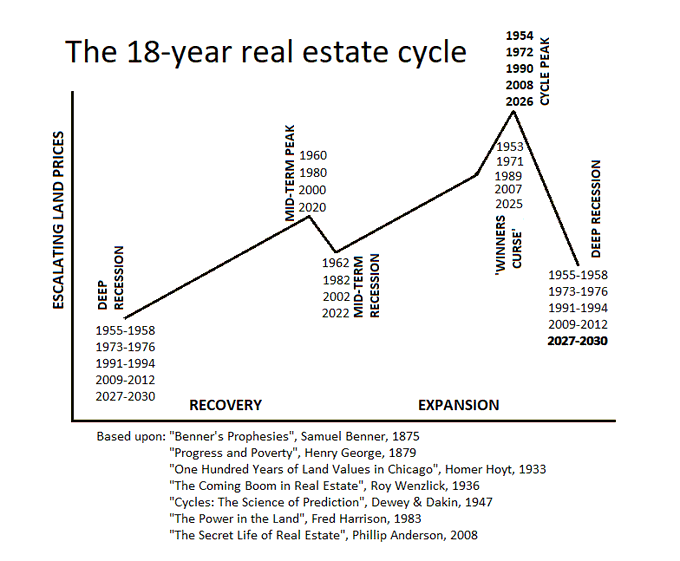
Cycle description slide — annotated diagram of the cycle’s key turning points.
Source: 2022-10-01-bbi-gold-coast-session-part-2
 18–20 year economic cycle — market context and Phil Anderson framework.
Source: 2022-10-01-bbi-gold-coast-session-part-1
18–20 year economic cycle — market context and Phil Anderson framework.
Source: 2022-10-01-bbi-gold-coast-session-part-1
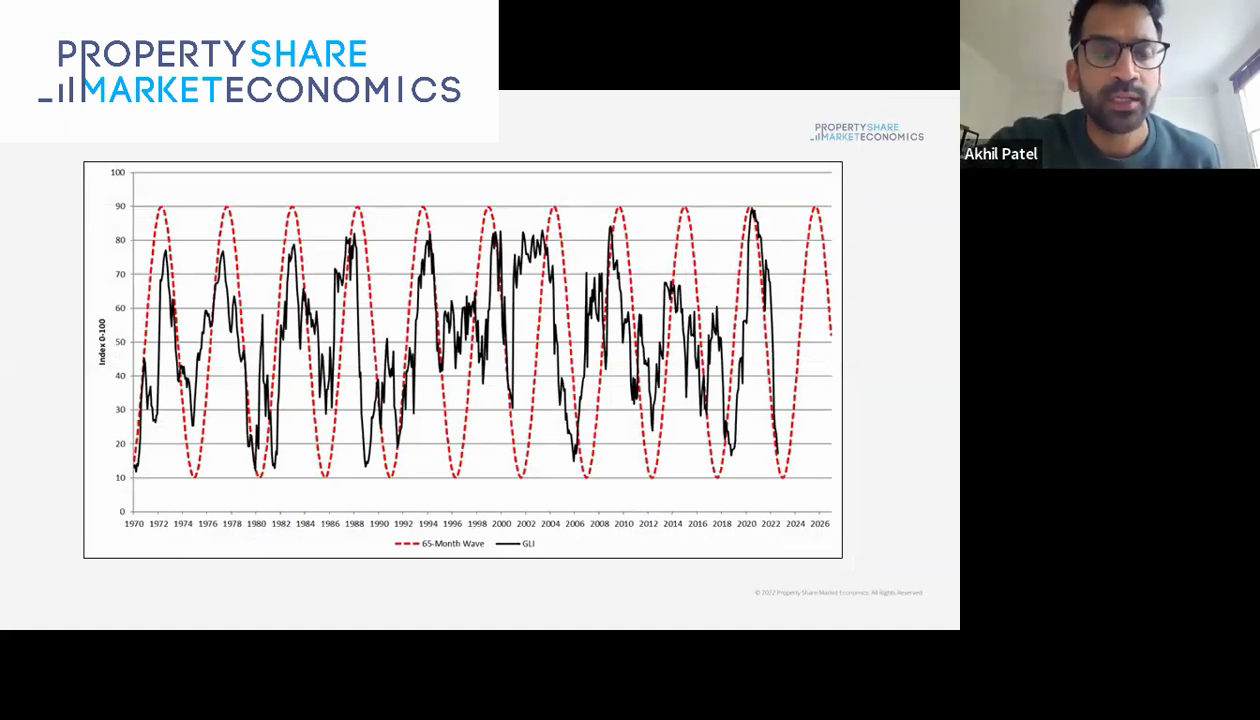
 Graph of the 18-year real estate cycle — historical data overlay.
Source: PSE Video
Graph of the 18-year real estate cycle — historical data overlay.
Source: PSE Video
 Cycle chart with annotated phases — Phil Anderson’s four-stage model.
Source: 2022-10-01-bbi-gold-coast-session-part-1
Cycle chart with annotated phases — Phil Anderson’s four-stage model.
Source: 2022-10-01-bbi-gold-coast-session-part-1
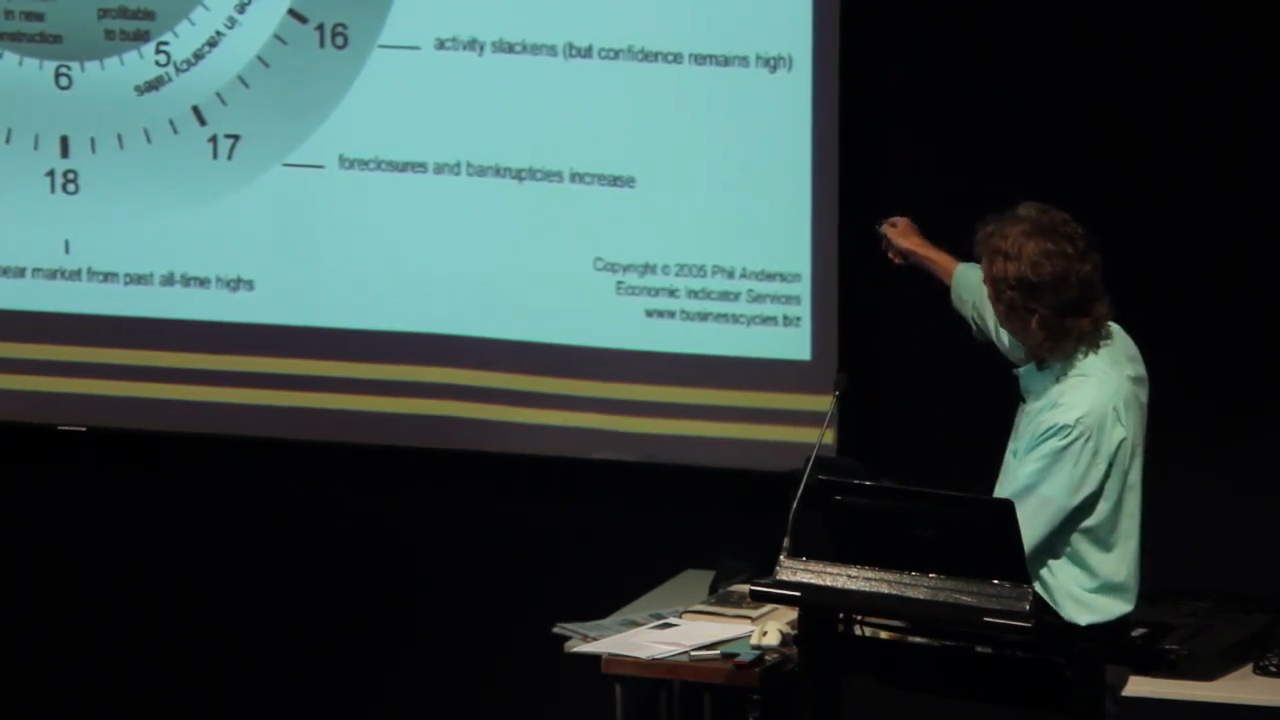 Property clock — circular representation of the real estate cycle phases.
Source: PSE Video
Property clock — circular representation of the real estate cycle phases.
Source: PSE Video
 EIS 18-Year Property Clock — PSE/EIS version of the cycle clock.
Source: PSE Video
EIS 18-Year Property Clock — PSE/EIS version of the cycle clock.
Source: PSE Video
 Describing the 18–20 year cycle — slide from PSE video presentation.
Source: 2022-10-01-bbi-gold-coast-session-part-1
Describing the 18–20 year cycle — slide from PSE video presentation.
Source: 2022-10-01-bbi-gold-coast-session-part-1
 Real estate market graph — historical price trajectory over cycle periods.
Source: 2024-01-01-bbi-january-2024
Real estate market graph — historical price trajectory over cycle periods.
Source: 2024-01-01-bbi-january-2024