Summary
The Bubble Index and Rule of 20 are two of PSE’s proprietary market valuation indicators, tracked since 1999. The Bubble Index is an overvaluation gauge for major equity indexes (All Ords, Dow, NASDAQ, FTSE). The Rule of 20 is a P/E + inflation fair-value assessment tool stating that markets are fairly valued when P/E ratio + inflation rate equals 20. PSE has published these as part of its quarterly Indicators Chartbook since 1999. Both are used as late-cycle overvaluation confirmation tools rather than timing tools. The Rule of 20 has a long history in mainstream valuation analysis; PSE applies it within the cycle framework.
Bubble Index
Definition and Construction
The Bubble Index measures how far major equity markets are from fair value. Phil Anderson specified (April 2026) that the Dow 30 Bubble Index tracks the percentage of the Dow’s 30 underlying constituents trending up versus a rolling 9 months. Historical thresholds: red line >90 often suggests a Dow peak is imminent; the next reading above 80 will be important if the Dow continues higher. As of late April 2026, the red line has been in a steady year-long decline — a breadth divergence consistent with the Roadmap’s late-April/May change-in-trend signal. [Source: PSE Gann #08, 2026-04-28]
Coverage
PSE tracks Bubble Index for:
- Australian All Ordinaries
- Dow Jones Industrial Average (US)
- NASDAQ (US)
- FTSE (UK)
- Started publishing from 1999–2000
Historical Archive
From the Indicators Catalog, the Bubble Index has been published regularly since 2000:
- 2000 publications show elevated readings during dot-com peak
- 2010–2013: Tracking post-GFC recovery
- 2020–2021: Resumed regular publication
Interpretation
- High Bubble Index reading = market significantly above fair value = late-cycle warning
- PSE uses it as a confirmatory indicator alongside the real estate cycle clock
- A sustained high Bubble Index does NOT signal an imminent crash — markets can remain overvalued for 2–4 years at cycle peak
Rule of 20
Definition & Formula
The Rule of 20 states:
Fair value when: P/E ratio + CPI inflation rate = 20
- If P/E + inflation < 20: market is undervalued (buy signal)
- If P/E + inflation > 20: market is overvalued (caution)
- If P/E + inflation = 20: fair value
Example: P/E = 15 and inflation = 5% → Rule of 20 = 20 (fairly valued) Example: P/E = 22 and inflation = 3% → Rule of 20 = 25 (overvalued by 25%)
Coverage
PSE tracks Rule of 20 for:
- Australia
- US
- Published since 1999
Historical Archive
From the Indicators Catalog:
- rule-of-20-as-at-end-1999.md through rule-of-20-december-2007.md
- Continued through 2013 and beyond
- Included in quarterly Indicators Chartbook PDFs (2022–2025)
Interpretation
- Rule of 20 provides a simple, easily communicated fair-value benchmark
- Works across different inflation regimes (high inflation = lower P/E is still “fairly valued”)
- Used alongside Bubble Index for confirming overvaluation at cycle peak
Combined Use in PSE Framework
PSE typically presents these indicators as a “dashboard” alongside:
- Economic Bliss Index (Australian + US relative market value)
- Yield Curve / Economic Barometer (leading recession signal)
- Margin Debt (leverage indicator)
- New Highs / New Lows List (market breadth)
- Tax Freedom Day (fiscal burden on economy)
The quarterly Indicators Chartbook (published Q1–Q4 each year, available to PSE subscribers) presents all these together.
Key Evidence: Late-Cycle Confirmation (Jan 2026)
2026-01-21-trump-running-hot references the Bubble Index in the context of all the classic “Winner’s Curse” signs being present:
- AI circular investment loops
- Massive corporate leverage (Amazon, Meta, Microsoft: from cash piles to net debtors)
- Private credit unprecedented leverage
- Bubble Index elevated = valuation confirmation of late-cycle excess
Applications
- Rule of 20: Quick screen for whether a market is fundamentally over/undervalued given current inflation
- Bubble Index: Track trend over months; when persistently high for 12+ months = strong late-cycle confirmation
- Not a timing tool: High readings can persist for 2–3 years before correction
- Combine with: PSE Clock, Gann time counts, homebuilder ETF trend for timing signals
- Watch for: Bubble Index + Rule of 20 both elevated + PSE Clock at 3pm = highest risk posture warranted
Contradictions & Open Questions
- The exact formula for the Bubble Index (beyond the Dow 30 breadth measure described in April 2026) is not fully publicly documented
- In a low-inflation / zero-rate environment, the Rule of 20 breaks down (what is “fair P/E” when rates are near zero?)
- High P/E can be sustained longer than the Rule of 20 suggests in ZIRP environments (as seen 2015–2022)
- Does PSE adjust the Rule of 20 formula for secular low-inflation environments?
Related Concepts
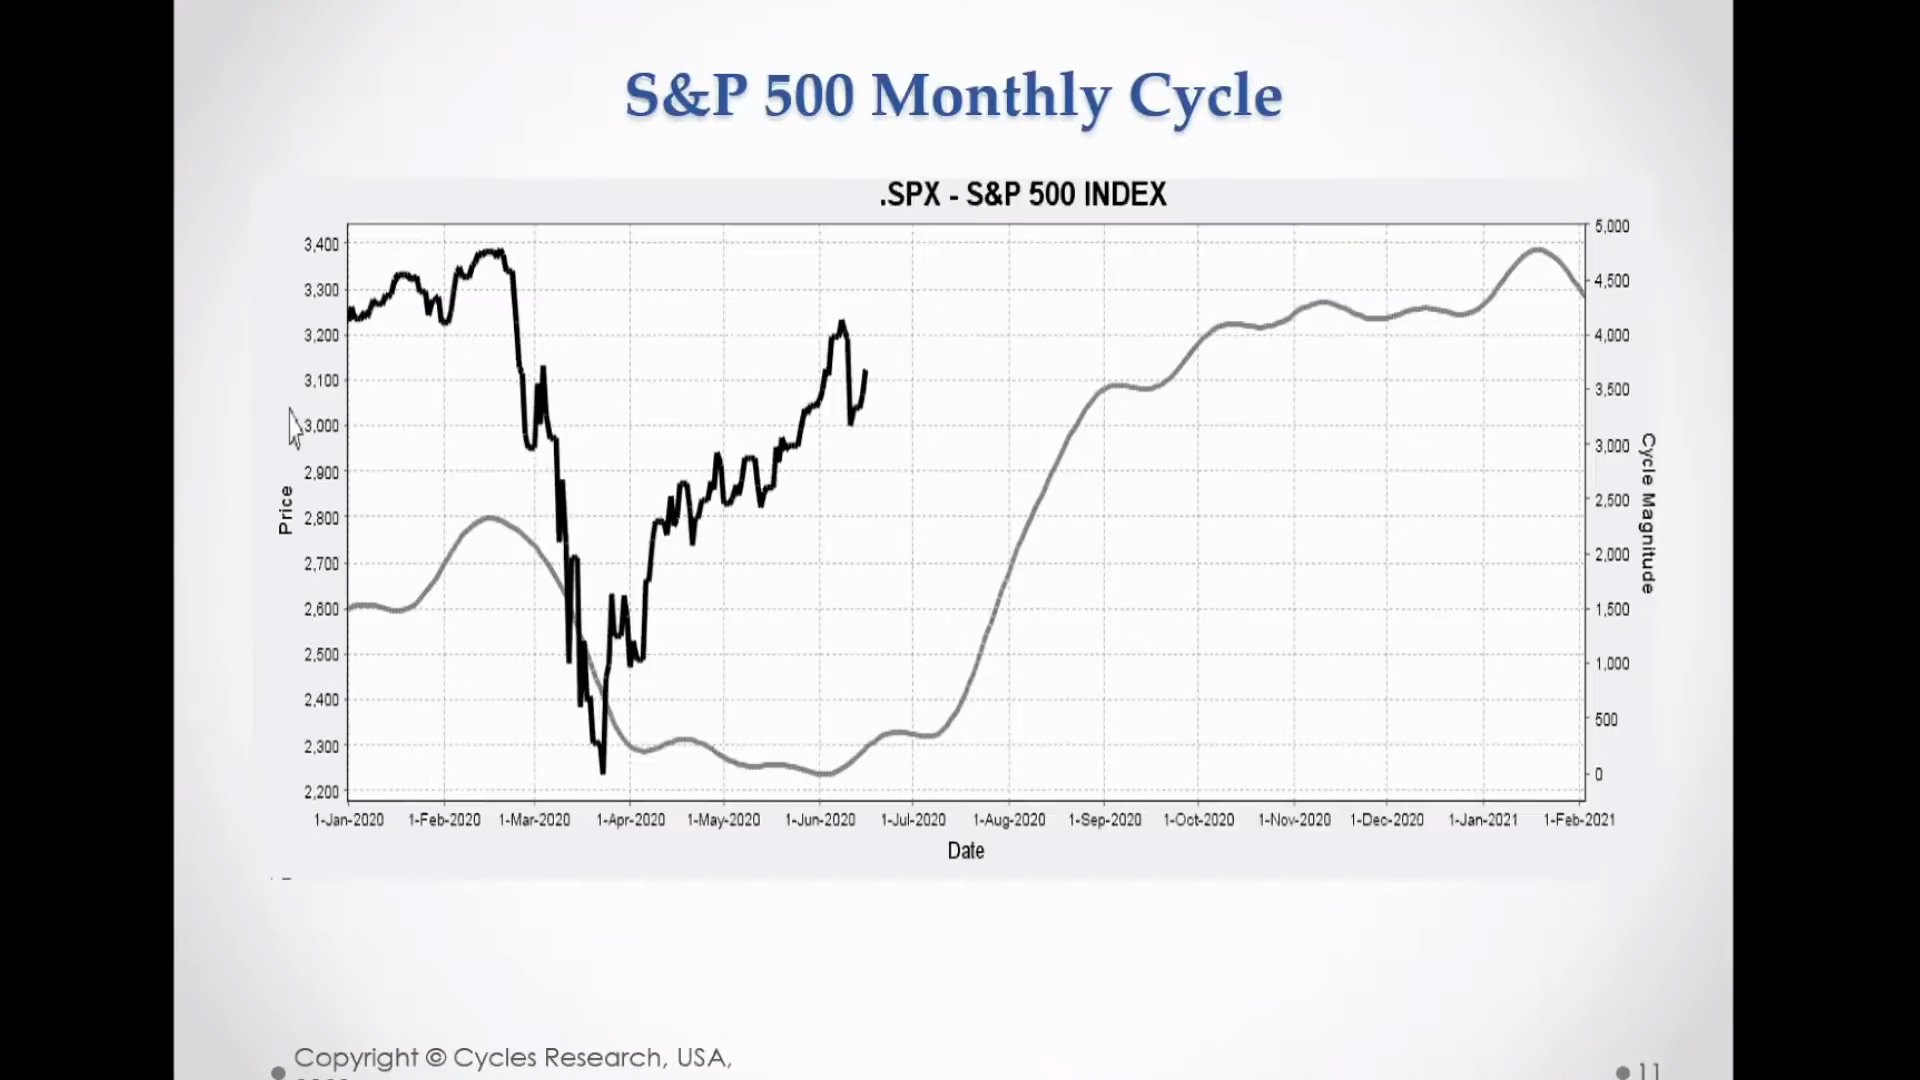 S&P 500 current vs historical — valuation comparison used in bubble index analysis.
Source: PSE Video
S&P 500 current vs historical — valuation comparison used in bubble index analysis.
Source: PSE Video
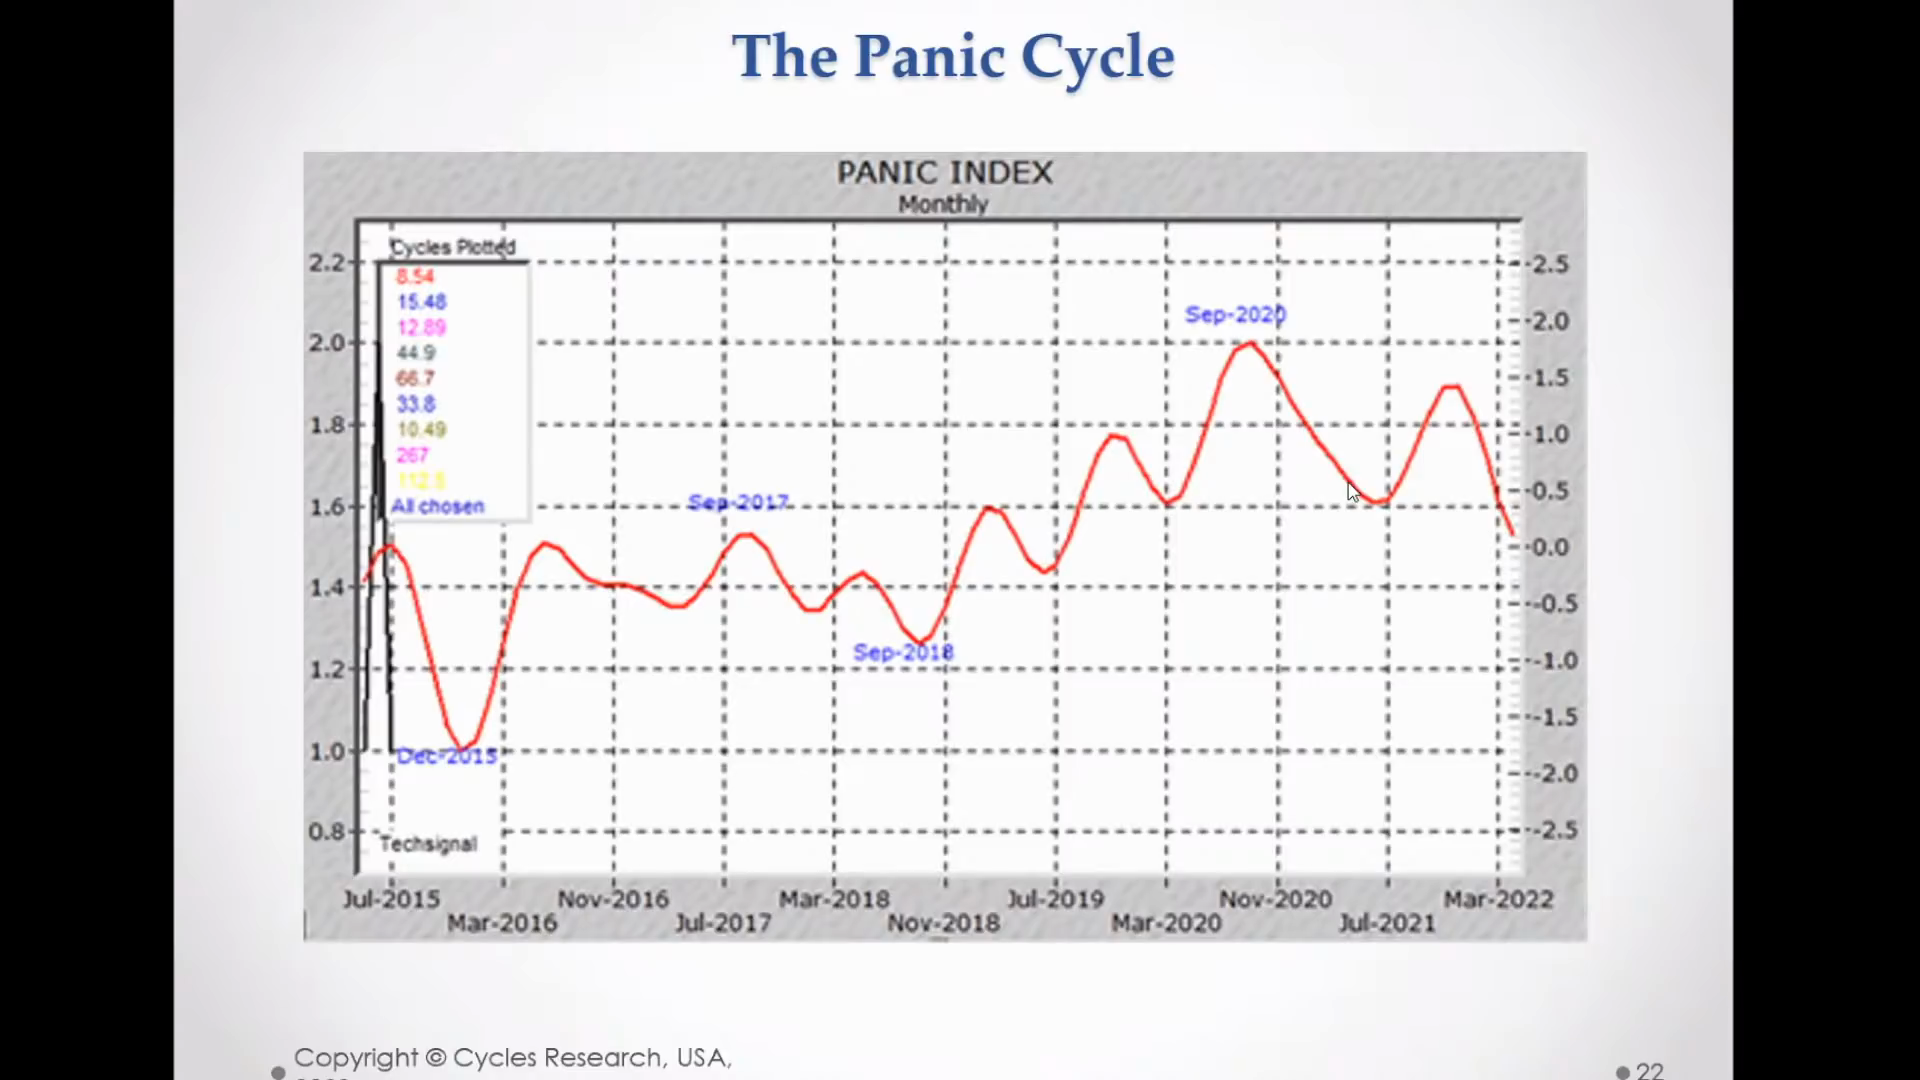 Panic index — PSE’s proprietary bubble/speculative excess indicator.
Source: PSE Video
Panic index — PSE’s proprietary bubble/speculative excess indicator.
Source: PSE Video
More Charts
 Panic index description — how the PSE Panic Index quantifies speculative mania.
Source: PSE Video
Panic index description — how the PSE Panic Index quantifies speculative mania.
Source: PSE Video
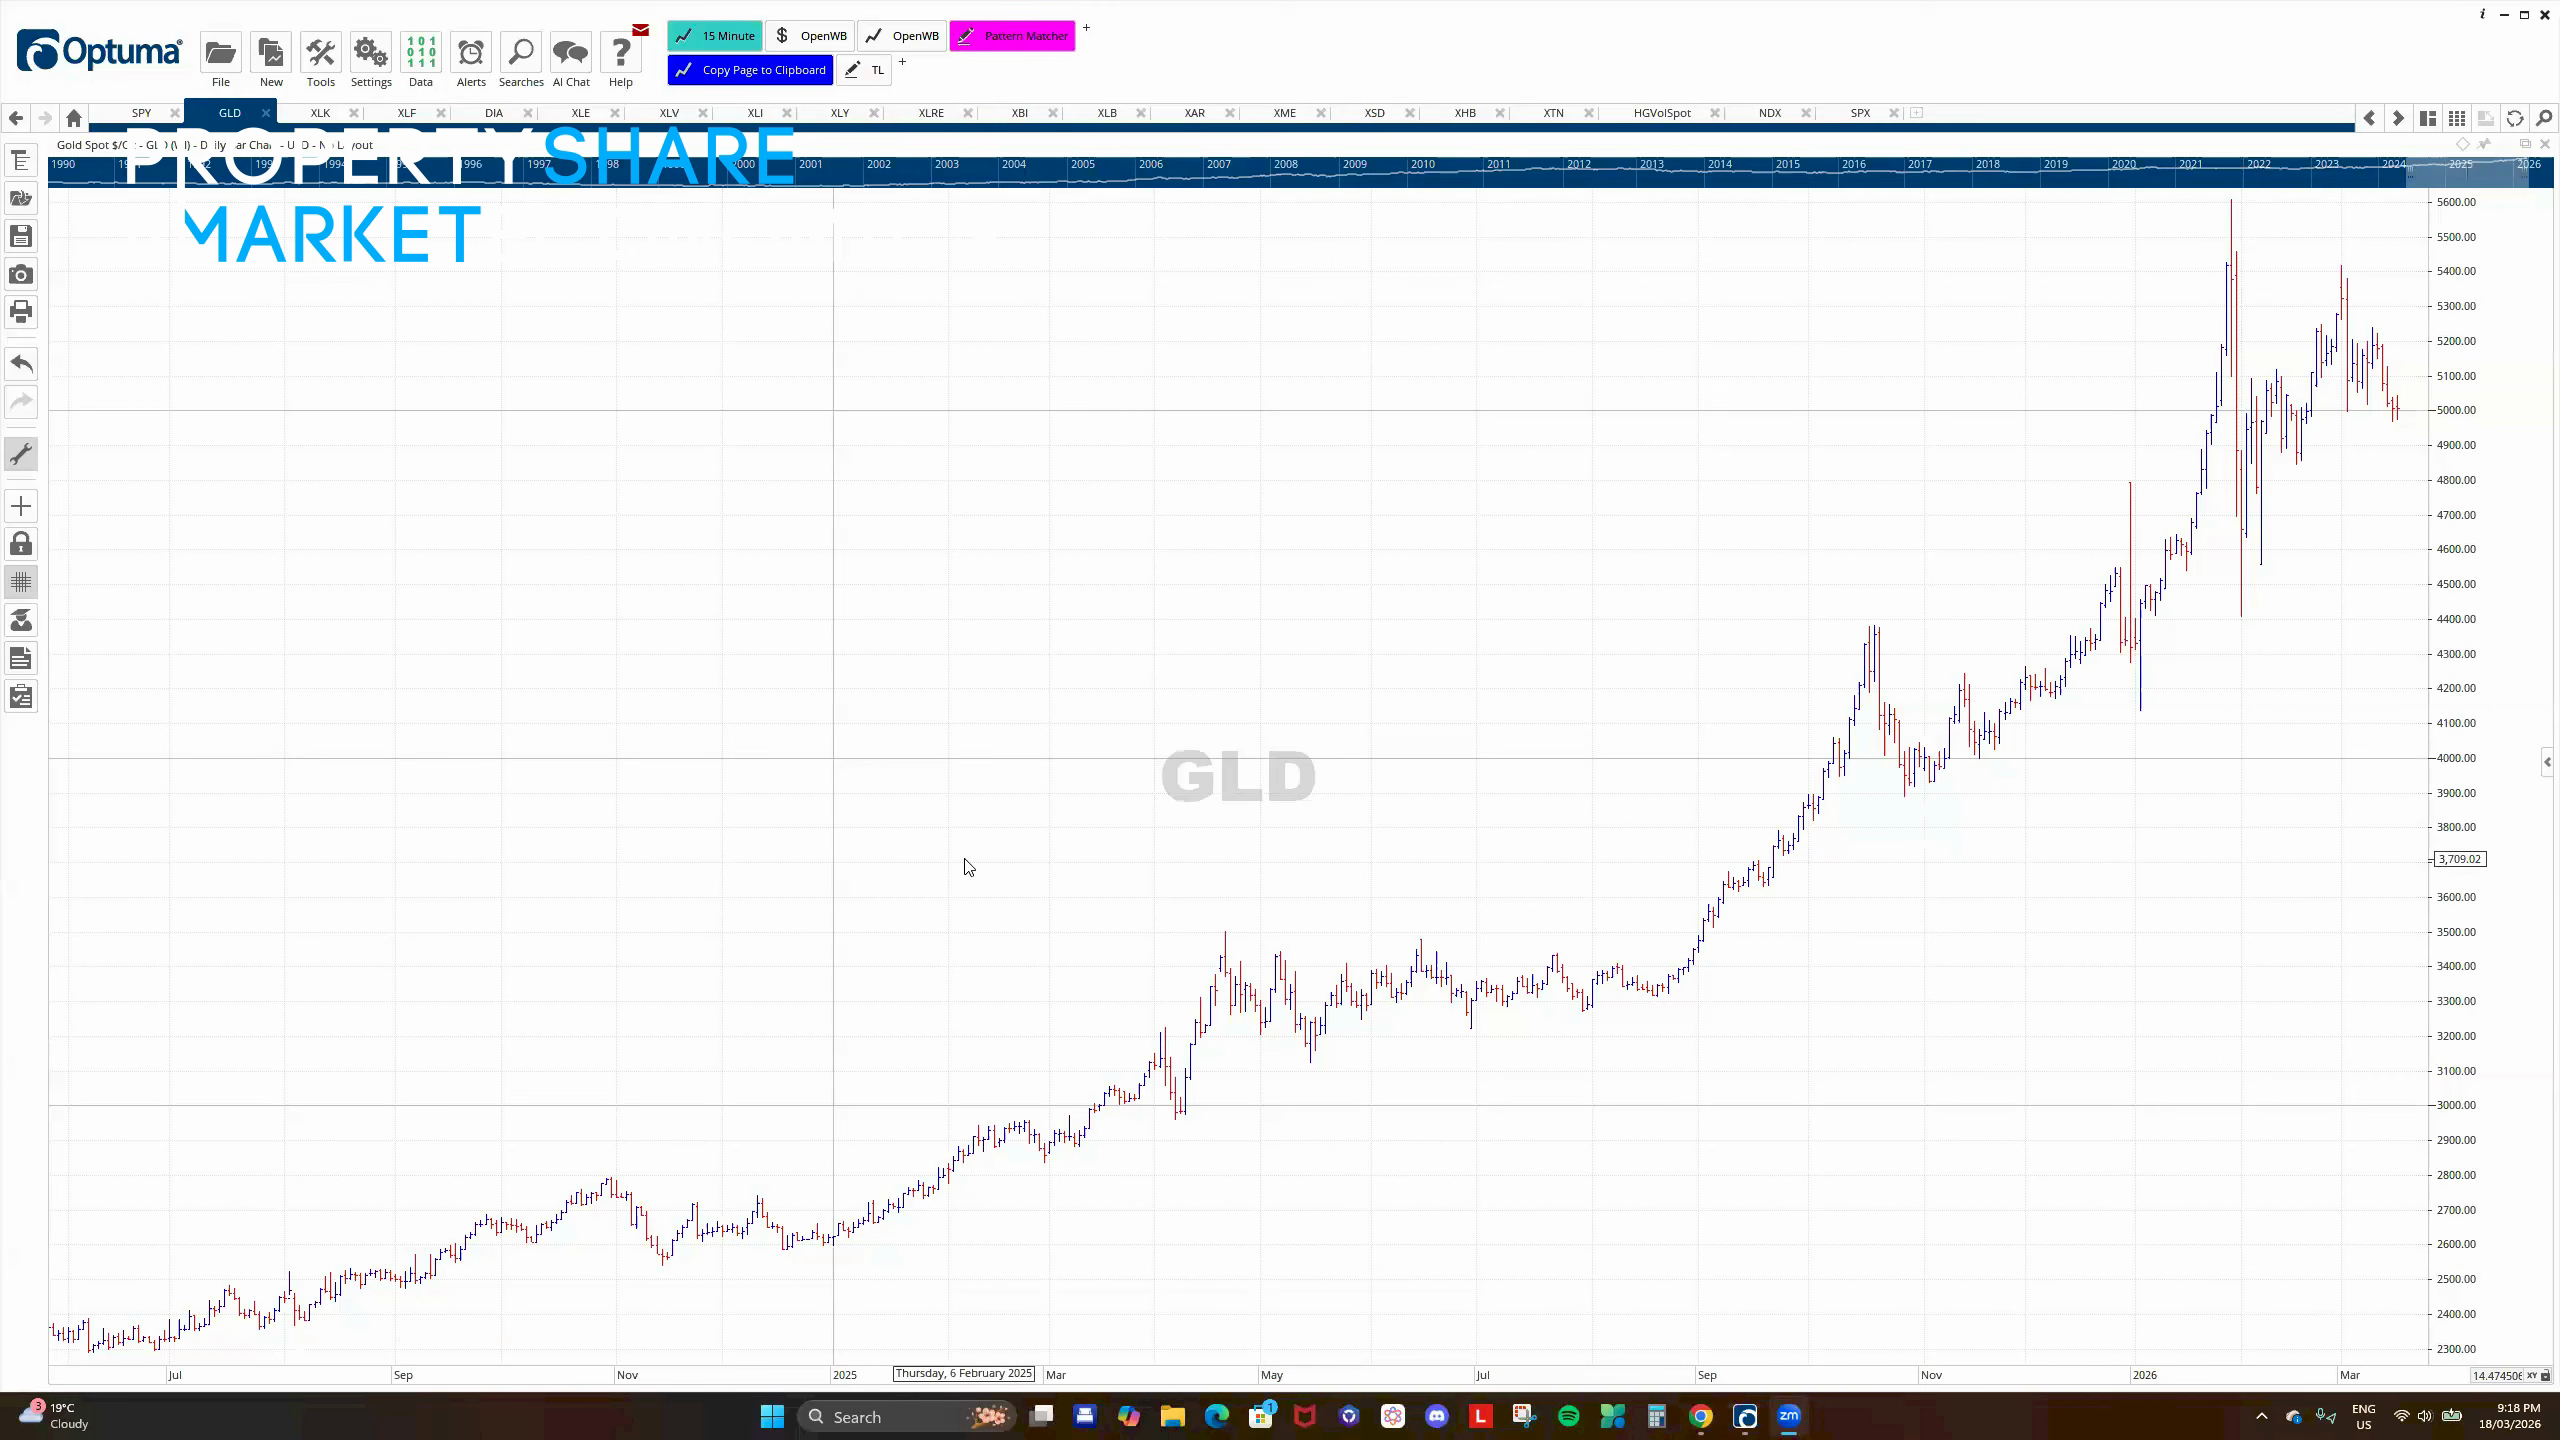 Market data with indicators — valuation and momentum indicators at cycle peak.
Source: PSE Video
Market data with indicators — valuation and momentum indicators at cycle peak.
Source: PSE Video
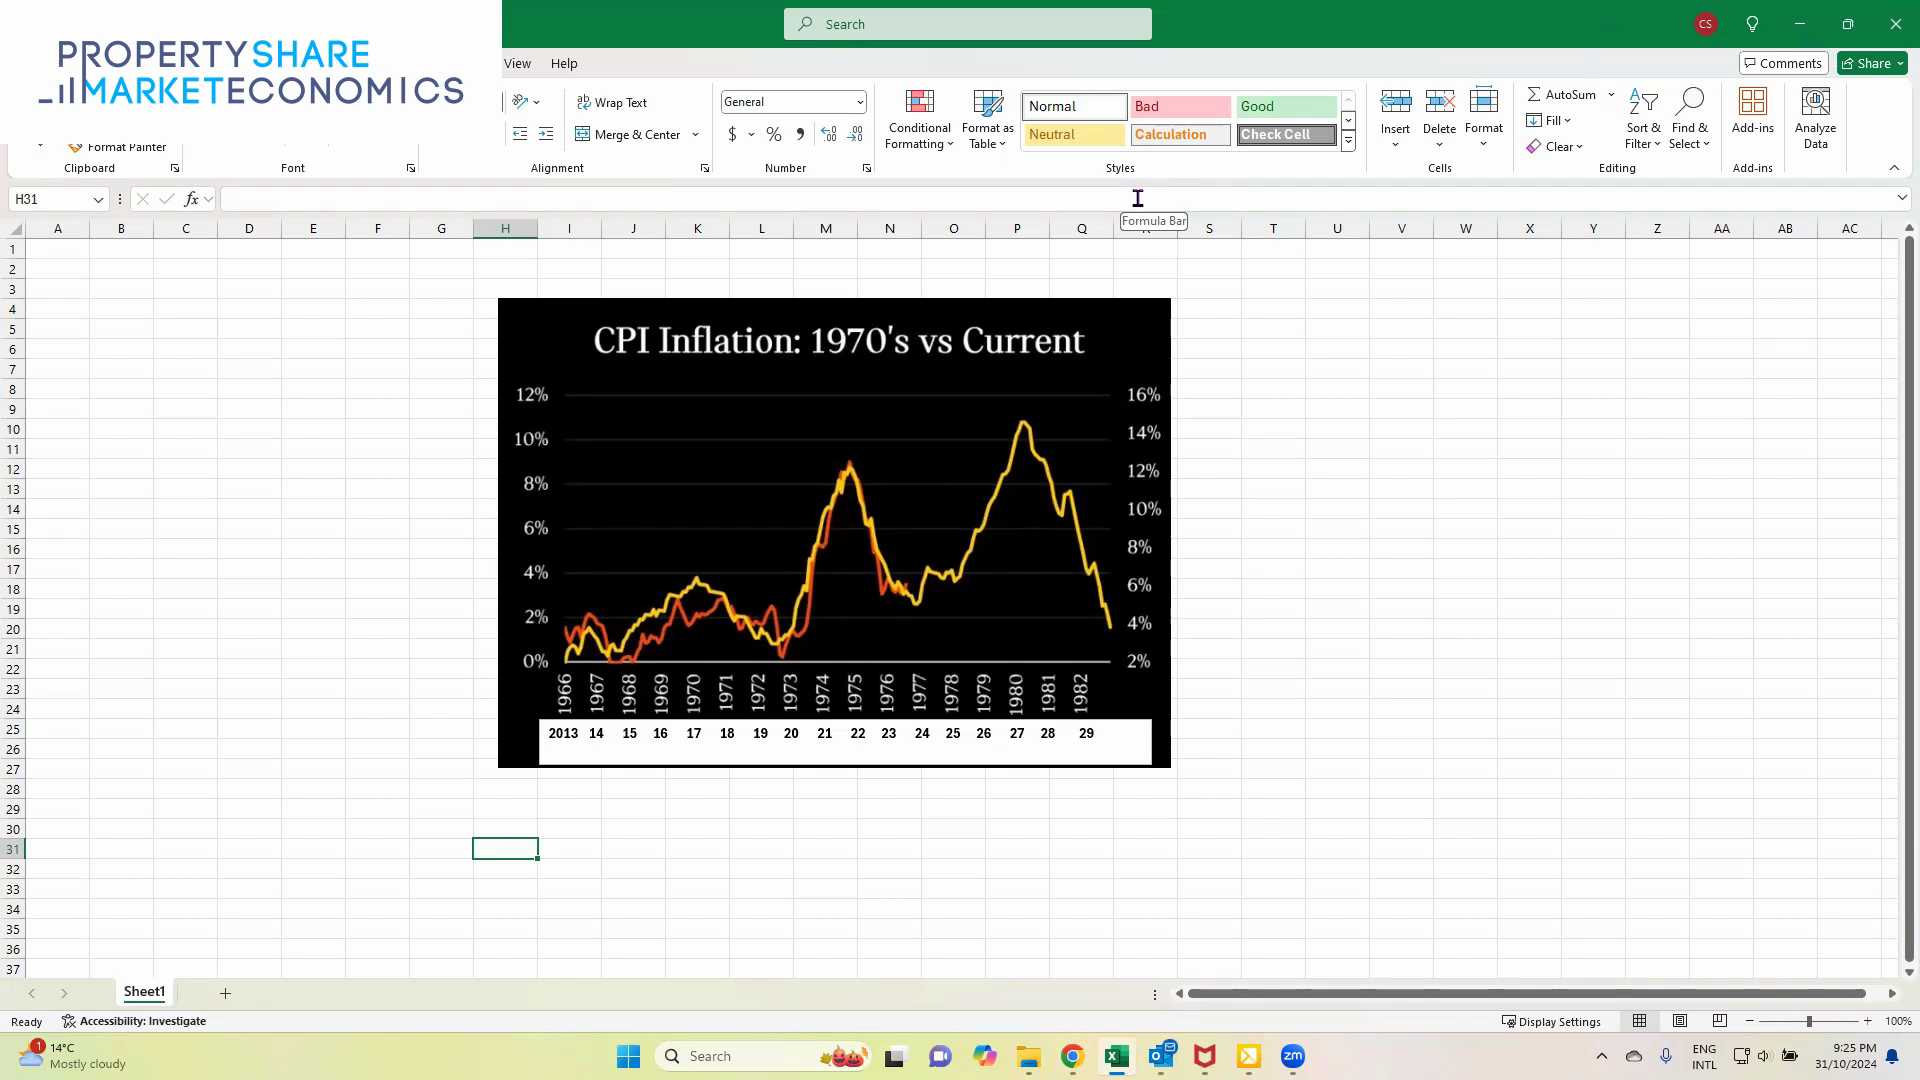 CPI inflation comparison — inflation component of the Rule of 20 P/E formula.
Source: PSE Video
CPI inflation comparison — inflation component of the Rule of 20 P/E formula.
Source: PSE Video