Summary
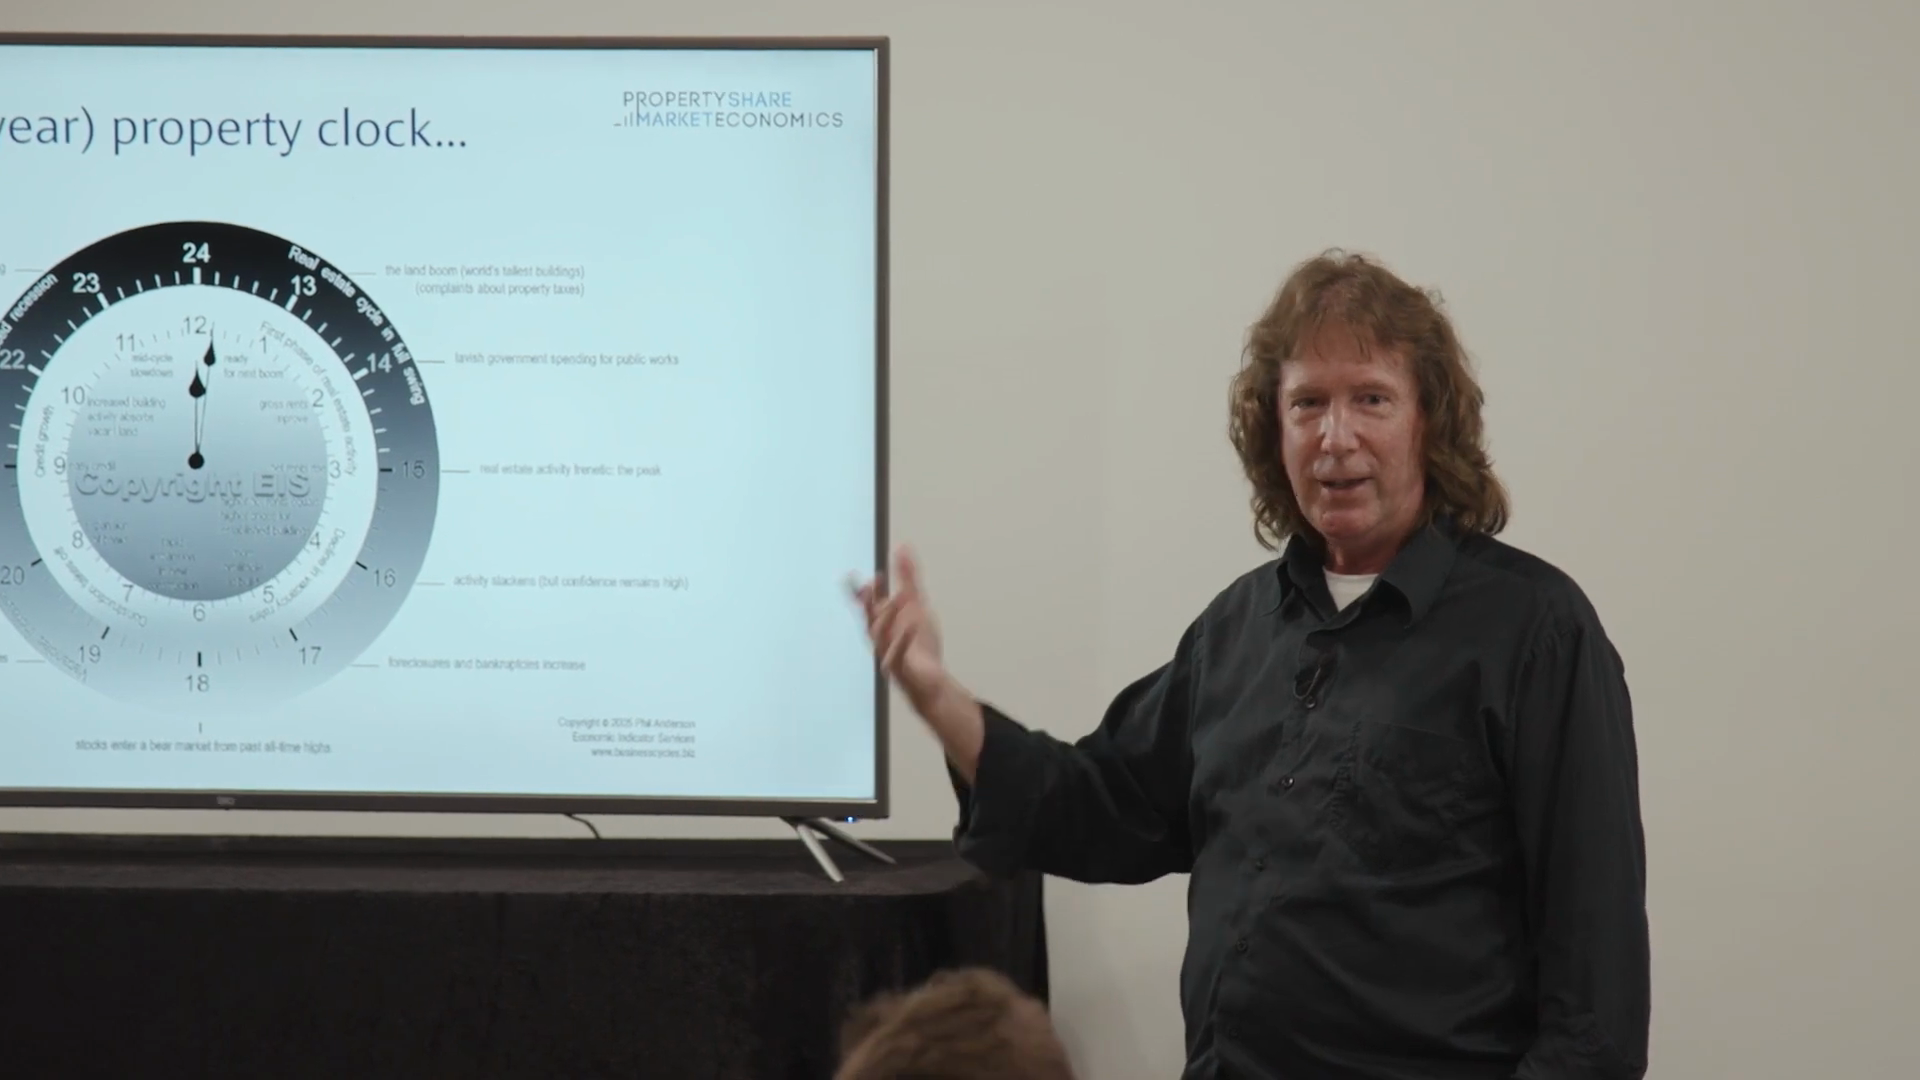
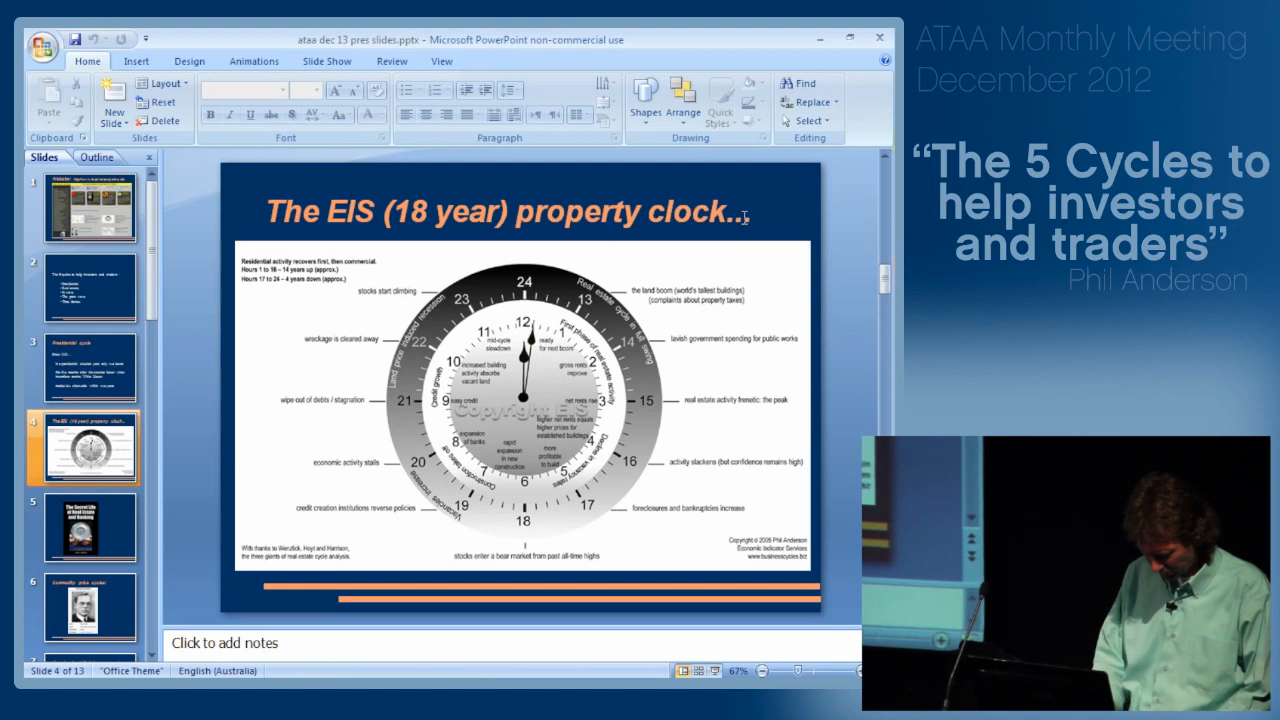
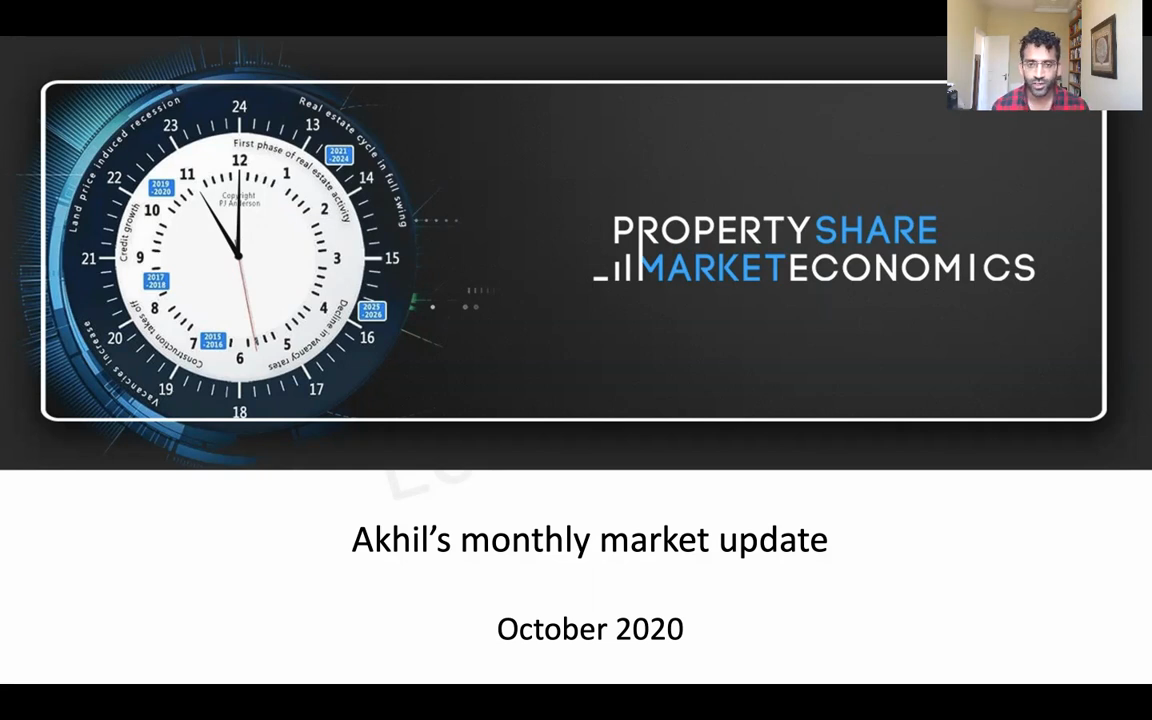
The PSE Clock is a circular diagram that maps the 18.6-year real estate cycle onto a 24-hour clock face. Each “hour” represents a phase of the cycle. The clock framework was developed from Homer Hoyt’s 1933 list of 20 sequential phases in Chicago land market cycles (later extended by Phil Anderson with 4 stock market points). As of the week of March 23, 2026, the PSE website’s clock showed “3pm” — the phase described as “the final frantic peak in real estate activity.”
Core Claims
- 2026-03-23-private-credit-crumble (2026-03-23): “The PSE clock on our website turned to 3pm last week. The final frantic peak in real estate activity.” — Darren Wilson — confidence: high
- 2026-02-02-bird-flu-timing (2026-02-02): PSE clock shows “14 up, 4 down” structure; current reading maps to the late-peak phase. — confidence: high
- Multiple BBI sources confirm the clock positions for 2015–2026 were forecast in advance and have confirmed as expected.
The 24-Phase Cycle Clock
Based on Homer Hoyt’s 1933 list (from George Olcott’s century of Chicago land records) plus Phil Anderson’s extensions:
| Clock Position | Phase Description | Approx Year (Current Cycle) |
|---|---|---|
| 12:00 (start) | Recovery begins; rents improve, people need housing | ~2012 |
| 3:00 | Net rents rise → higher prices for established buildings | ~2016–17 |
| 6:00 | Cheaper to build new → developers back; land prices rising | ~2018–19 |
| 9:00 | Credit growth; banks pushing loans; easy money | ~2020–21 |
| 11:00 | Mid-cycle slowdown | ~2020 (COVID) |
| 12:00 (second pass) | Land boom, world’s tallest buildings, complaints about property tax | ~2022–23 |
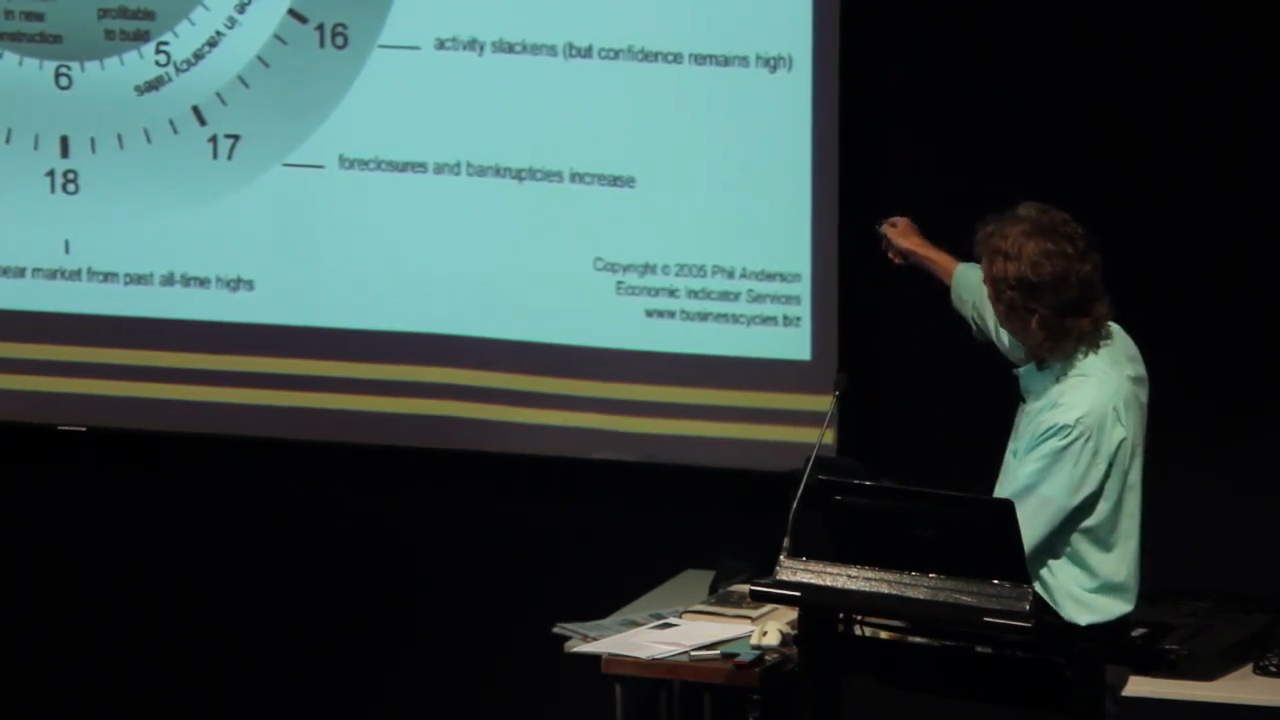
| 1:00–2:00 | Real estate activity frenetic | ~2024–25 |
| 3:00 pm | ”Final frantic peak in real estate activity” | March 23, 2026 |
| 6:00 pm | Panic selling; forced sales | ~2027? |
| 9:00 pm | Declining values; credit squeeze | ~2028–29? |
| 12:00 midnight | Trough / new cycle low | ~2029–30? |
Note: The clock face wraps; the second 12-o’clock to 3-o’clock arc (afternoon) represents the final speculative peak phase of the cycle.
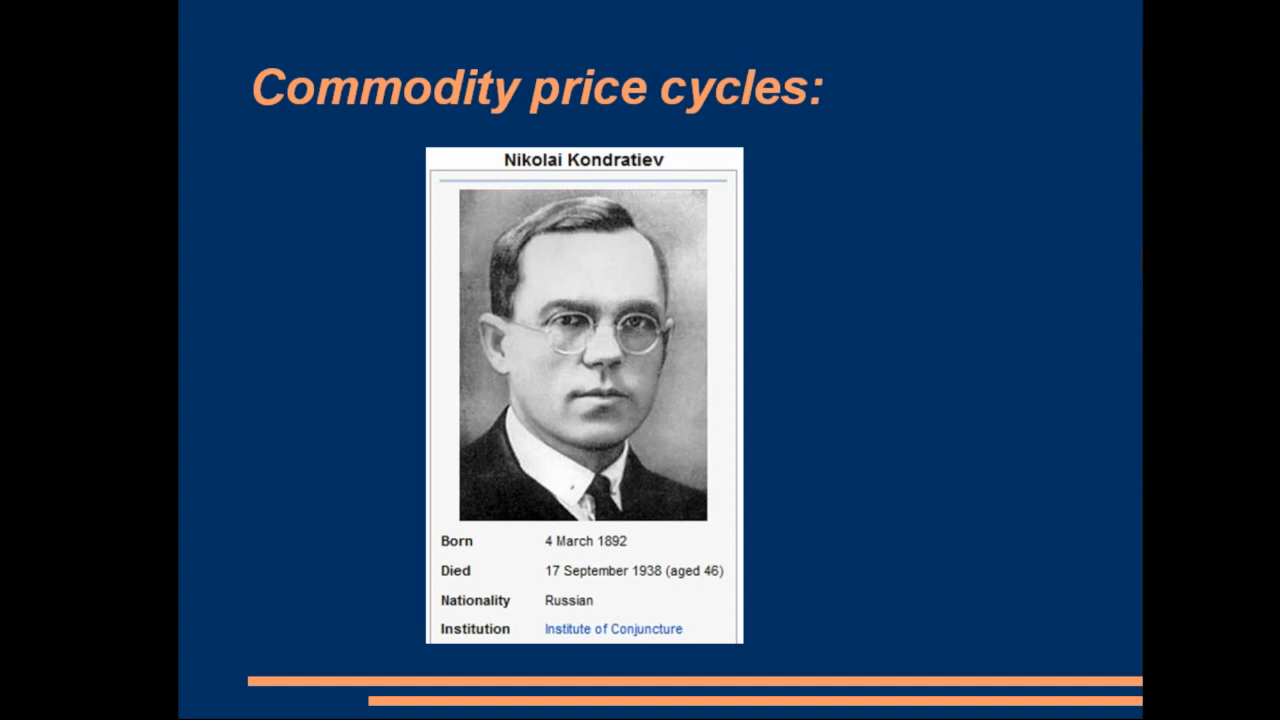
Homer Hoyt’s Source
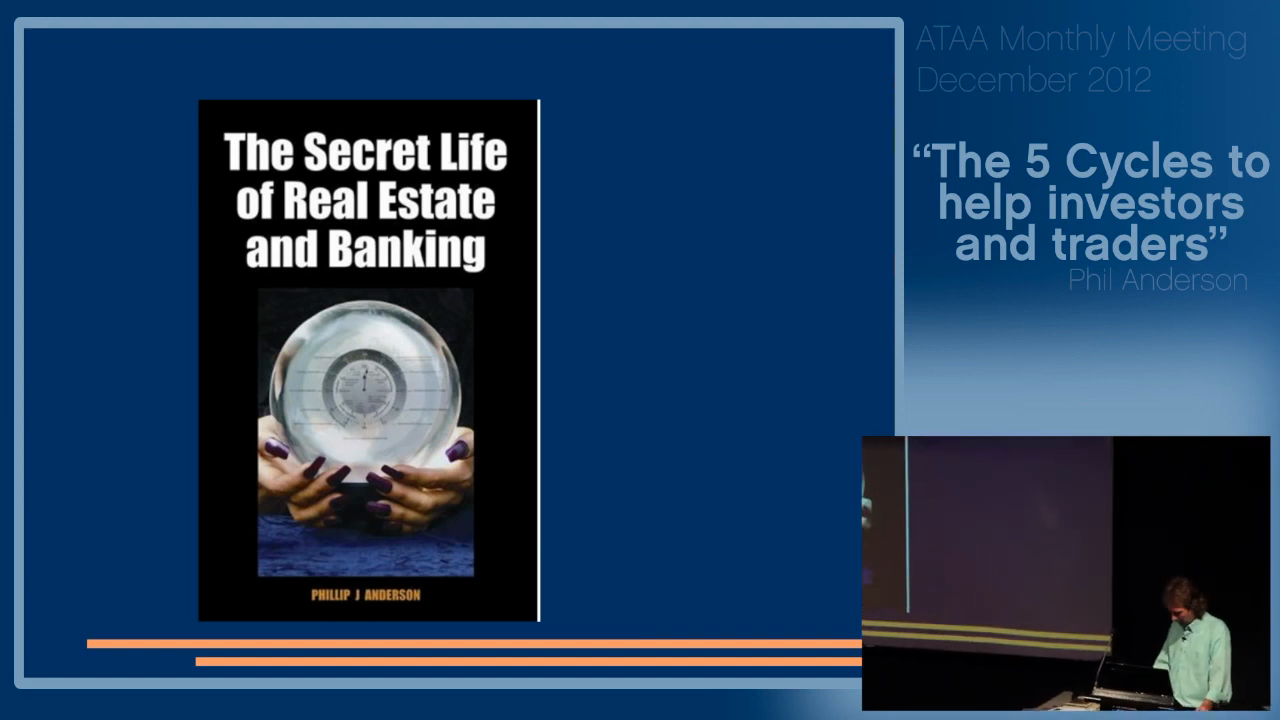
- Phil Anderson’s 2008 book “The Secret Life of Real Estate and Banking” (Chapter 19, ‘What Time Is It?’) formally introduced the clock as a subscriber tool; by the time of publication it had already tracked the 1992 cycle accurately.
- The 20 phase points originate from Homer Hoyt’s 1933 analysis of over a century of Chicago lot-sale data compiled by George Olcott
- Phil Anderson added 4 additional stock market points to extend the model
- The clock was originally called the “24-hour real estate clock” in the 2008 first edition; renamed to “18-year real estate clock” from the 2009 reprint onward based on subscriber feedback. [Source: The Secret Life of Real Estate and Banking, 2008]
Key Milestones (Current Cycle)
- 7–8 o’clock (~2015–16): Easy credit conditions, first phase of land boom
- 9 o’clock (~2019–20): Mid-cycle; banks still pushing loans
- 11 o’clock (~2020): Mid-cycle slowdown (COVID interruption)
- 12–1 o’clock (~2021–24): Land boom / frenetic activity
- 3 o’clock (March 23, 2026): Final frantic peak confirmed
Phil Anderson’s own description: “The real estate clock with dates (2015-16 = clock positions 6-8, 2017-18 = 8-9, 2019-20 = mid-cycle, 2021+ = second half outer) — forecast before it happened and confirmed.”
Applications
- Use clock position to calibrate risk: at 3pm, maximum caution required
- Pre-3pm positions: buyers still entering; post-3pm: sellers must move quickly
- Combine with specific Gann time counts and seasonal dates for precise timing
- The PSE website publicly displays the current clock position as a subscriber tool
Contradictions & Open Questions
- The clock gives phase but not precise timing — “3pm” could represent weeks to months of peak activity
- Does “3pm → 6pm” transition happen suddenly or over 1–2 years?
- Can the clock “reverse” if major stimulus delays the turn (as COVID stimulus did in 2020)?
Related Concepts
Visual Evidence
Slides showing the PSE property clock and its cycle phase indicators.
 Circular clock diagram — economic phases mapped to clock positions (PSE model).
Source: PSE Video
Circular clock diagram — economic phases mapped to clock positions (PSE model).
Source: PSE Video
 Property clock with phases — PSE clock showing current cycle position.
Source: PSE Video
Property clock with phases — PSE clock showing current cycle position.
Source: PSE Video
 18-year property clock — complete cycle clock with phase labels.
Source: 2022-10-01-bbi-gold-coast-session-part-1
18-year property clock — complete cycle clock with phase labels.
Source: 2022-10-01-bbi-gold-coast-session-part-1
 Property cycle clock — visual cycle indicator used in PSE member materials.
Source: PSE Video
Property cycle clock — visual cycle indicator used in PSE member materials.
Source: PSE Video
 Clock diagram of market cycles — informational slide on cycle clock methodology.
Source: PSE Video
Clock diagram of market cycles — informational slide on cycle clock methodology.
Source: PSE Video
 Clock-like chart — feature presentation of the property clock framework.
Source: 2023-10-22-bbi-october-2023
Clock-like chart — feature presentation of the property clock framework.
Source: 2023-10-22-bbi-october-2023
 EIS 18-Year Property Clock — the PSE/EIS version of the clock diagram.
Source: PSE Video
EIS 18-Year Property Clock — the PSE/EIS version of the clock diagram.
Source: PSE Video
 PSE Clock slide — text slide explaining clock interpretation guidelines.
Source: PSE Video
PSE Clock slide — text slide explaining clock interpretation guidelines.
Source: PSE Video