Summary
In PSE’s framework, bond yields and the yield curve are among the most important cycle indicators — but they must be interpreted within the 18.6-year real estate cycle, not in isolation. A yield curve inversion does NOT signal an immediate crash; what signals the top is the re-inversion back to positive (the “un-inversion”). Rising long-bond yields at end-of-cycle confirm the credit tightening that terminates the cycle. The yield gap (government bond yield vs. industrial earnings yield) is PSE’s gauge of relative market valuation.
Core Claims
- 2025-07-10-gann-sub-email-gann-12-10-july-2025-property-sharemarket-economic (2025-07-10): “Just as the yield curve moves back into positive territory, most economists will think the recession alarm bell is being turned off. But it’s actually quite the opposite.” — Phil Anderson — confidence: high
- 2026-02-16-bitcoin-crash-end-of-cycle (2026-02-16): “This is how real estate cycles end – in tight money conditions and rising longer-term rates.” — confidence: high
- 2026-03-31-roadmap-update-march (2026-03-31): US 30-year yields likely to break above 5% — bad for markets. — confidence: high
- 2026-05-19-gann-12-market-update-may-2026 (2026-05-19): US 30-year Treasury yield has broken out above 5% from a Mexican Pete ascending triangle — yield at highest level since 2007. Market-implied odds now point to a Fed rate hike within six months. CPI +3.8% April YoY (largest in ~3 years); PPI +6.0% (largest since end-2022). “Everything in the market is brought together by interest rates.” — Phil Anderson — confidence: high
- 2021-03-03-sub-email-6-2021-roadmap-march-update (2021-03-03): Rising US bond yields (steepening yield curve) are bullish for banks and the second half of the cycle. — confidence: high
- 2021-06-09-sub-email-25-yield-curve-indicator (2021-06-09): “No US recessions occur when the yield curve is widening.” — Phil Anderson — confidence: high
- 2019-10-28-anderson-unencumbered-sydney-part1 (2019-10-28): The 2019 US and Australian yield curve inversions correctly predicted the onset of recession. — confidence: high
- 2025-07-10-gann-sub-email-gann-12-10-july-2025-property-sharemarket-economic (2025-07-10): The 2022 yield curve inversion did not signal an imminent recession because the real estate cycle placed the downturn still several years away — confidence: high
- 2026-01-15-additional-notes-roadmap (2026-01-15): “There are over $9 trillion in U.S. Treasuries maturing in 2026. That is about one-third of all U.S. Treasury securities outstanding.” — confidence: high
Mechanism / How It Works
The Yield Curve (Short vs. Long Rates)
- Normal/Widening (positive): Long rates > short rates → banks profitable (borrow short, lend long) → credit expansion → cycle continues
- Inverted (negative): Short rates > long rates → banks squeezed → credit contraction signal → recession follows (but NOT immediately in 18.6-year framework; can persist 1–3 years before collapse)
- Re-inversion to positive (PSE’s key signal): Curve reverting to normal AFTER inversion = recession imminent; markets typically rally while this happens (fooling most analysts)
The Yield Gap (PSE’s “Economic Barometer”)
- Formula: Government 10-year bond yield ÷ Industrials earnings yield
- High yield gap: Shares expensive relative to bonds; speculative conditions
- Low yield gap: Shares cheap relative to bonds; buying opportunity
- PSE has tracked the yield gap for Australia, US, UK, and NZ since 1999
- As of April 2020: share yields remained higher than bond yields → complete selloff considered unlikely
Bond Yields at Cycle End
- Short-term rates cut by central bank (QE) → fuels credit expansion
- Long-term rates start rising as inflation returns and government debt grows
- “Inversion resolves” → market interprets as all-clear; actually signals late-cycle
- Rising long bond yields make land debt unsustainable → cycle tips
- Key levels for 2026: US 30-year Treasury > 5% flagged as dangerous threshold
Key Data Points
- 2019 yield curve inversion: Correctly predicted 2020 recession (COVID)
- 2022 inversion: Phil Anderson argued this would NOT bring immediate crash due to cycle position (confirmed: no crash 2022–2025)
- 2025 un-inversion: Yield curve moving back to positive as of mid-2025 = genuine late-cycle warning
- March 2025 Gann email: US 30-year bond yield approaching 5%; viewed as breakout level
- 2026: Tariffs risk higher inflation → higher bond yields → potential cycle trigger
- March 2026 “Trump blink”: Bond market forced Trump to reverse tariff policy; speed of yield rise (not level) was the trigger
- May 19 2026 — 30yr breakout confirmed: US 30-year Treasury yield broke above 5% — highest since 2007 — from a Mexican Pete ascending triangle PSE had been tracking for months. Simultaneously: CPI +3.8% April YoY (3-year high), PPI +6.0% (highest since end-2022). Market pricing now reflects Fed rate hike probability within 6 months. Phil Anderson adds TBT (2× inverse Treasury ETF) to the Mex Pete model portfolio. [Source: PSE Gann #12, 2026-05-19]
- May 26 2026 — Anderson names long bond as primary watch indicator: In his ‘Beginning of the End’ email, Anderson explicitly elevates the long bond to the #1 cycle indicator: “Interest rates — especially the long bond — are what you need to watch now.” He also flags Japanese long-bond risk: rising Japanese rates incentivize capital repatriation and reduced buying of US Treasuries, adding a foreign demand squeeze to the domestic supply pressure. [Source: PSE Sub #26, 2026-05-26]
Yield Curve as Sector Signal
- Widening yield curve (positive): Banks profitable → buy banks early in second half
- Inverting/flat curve: Rotate away from banks; watch for credit stress
- Insurance stocks breaking out: Leading signal for higher long rates (insurance stocks = bond proxies)
- REITs: Sensitive to interest rate rises; underperformed 2022–2024 due to this sensitivity
PSE Indicators Chartbook (Yield)
PSE has tracked yield curves monthly since 1999 for:
- US (2yr/10yr spread; 30-year Treasury)
- Australia (bank bill rate vs. 10-year government bond)
- UK Key indicator files: yield-curves-the-economic-barometer.md, us-yield-curve-explanation.md, the-importance-of-a-yield-curve-inversion-and-when.md
Applications
- At cycle start: Rising long rates with widening curve = buy banks; cycle accelerating
- Mid-cycle: Monitor inversion; if yield curve inverts, don’t panic — check cycle position
- Late cycle: Watch for un-inversion (return to positive) — real recession warning
- End-of-cycle signal: 30-year Treasury breaking above 5% = credit cost unsustainable
- Yield gap: Use as valuation tool alongside Bubble Index and Rule of 20
The Great Maturity Wall (2026)
A specific bond yield risk flagged by Akhil Patel:
- $9 trillion in US Treasuries maturing in 2026 (~1/3 of all outstanding)
- ~$350 trillion in global corporate debt requiring refinancing (“Great Maturity Wall”)
- If yields stay elevated as this debt rolls over, credit contraction becomes automatic
- This is a structural amplifier of the cycle-end credit crunch
Contradictions & Open Questions
- PSE’s “un-inversion” signal is not universally recognized — mainstream economics treats the inversion itself as the recession signal
- The 2022 inversion lasted longer than most prior inversions without recession — Phil’s explanation (cycle position) held, but is hard to disprove
- Japanese government bond yield surge (2025, and reaffirmed May 2026) cited as potential global contagion risk — Anderson specifically flags Japan repatriation as a mechanism that could accelerate US Treasury yield rise
- Phil Anderson suggested (2021) currency crisis may be the cycle-end mechanism rather than bonds — these overlap but are distinct scenarios
Related Concepts
- 18-6-year-real-estate-cycle
- private-credit
- financial-timetable
- winners-curse-phase
- sector-rotation
- gold
- us-dollar-hegemony
Visual Evidence
Slides showing bond yields, treasury charts, and money flow analysis.
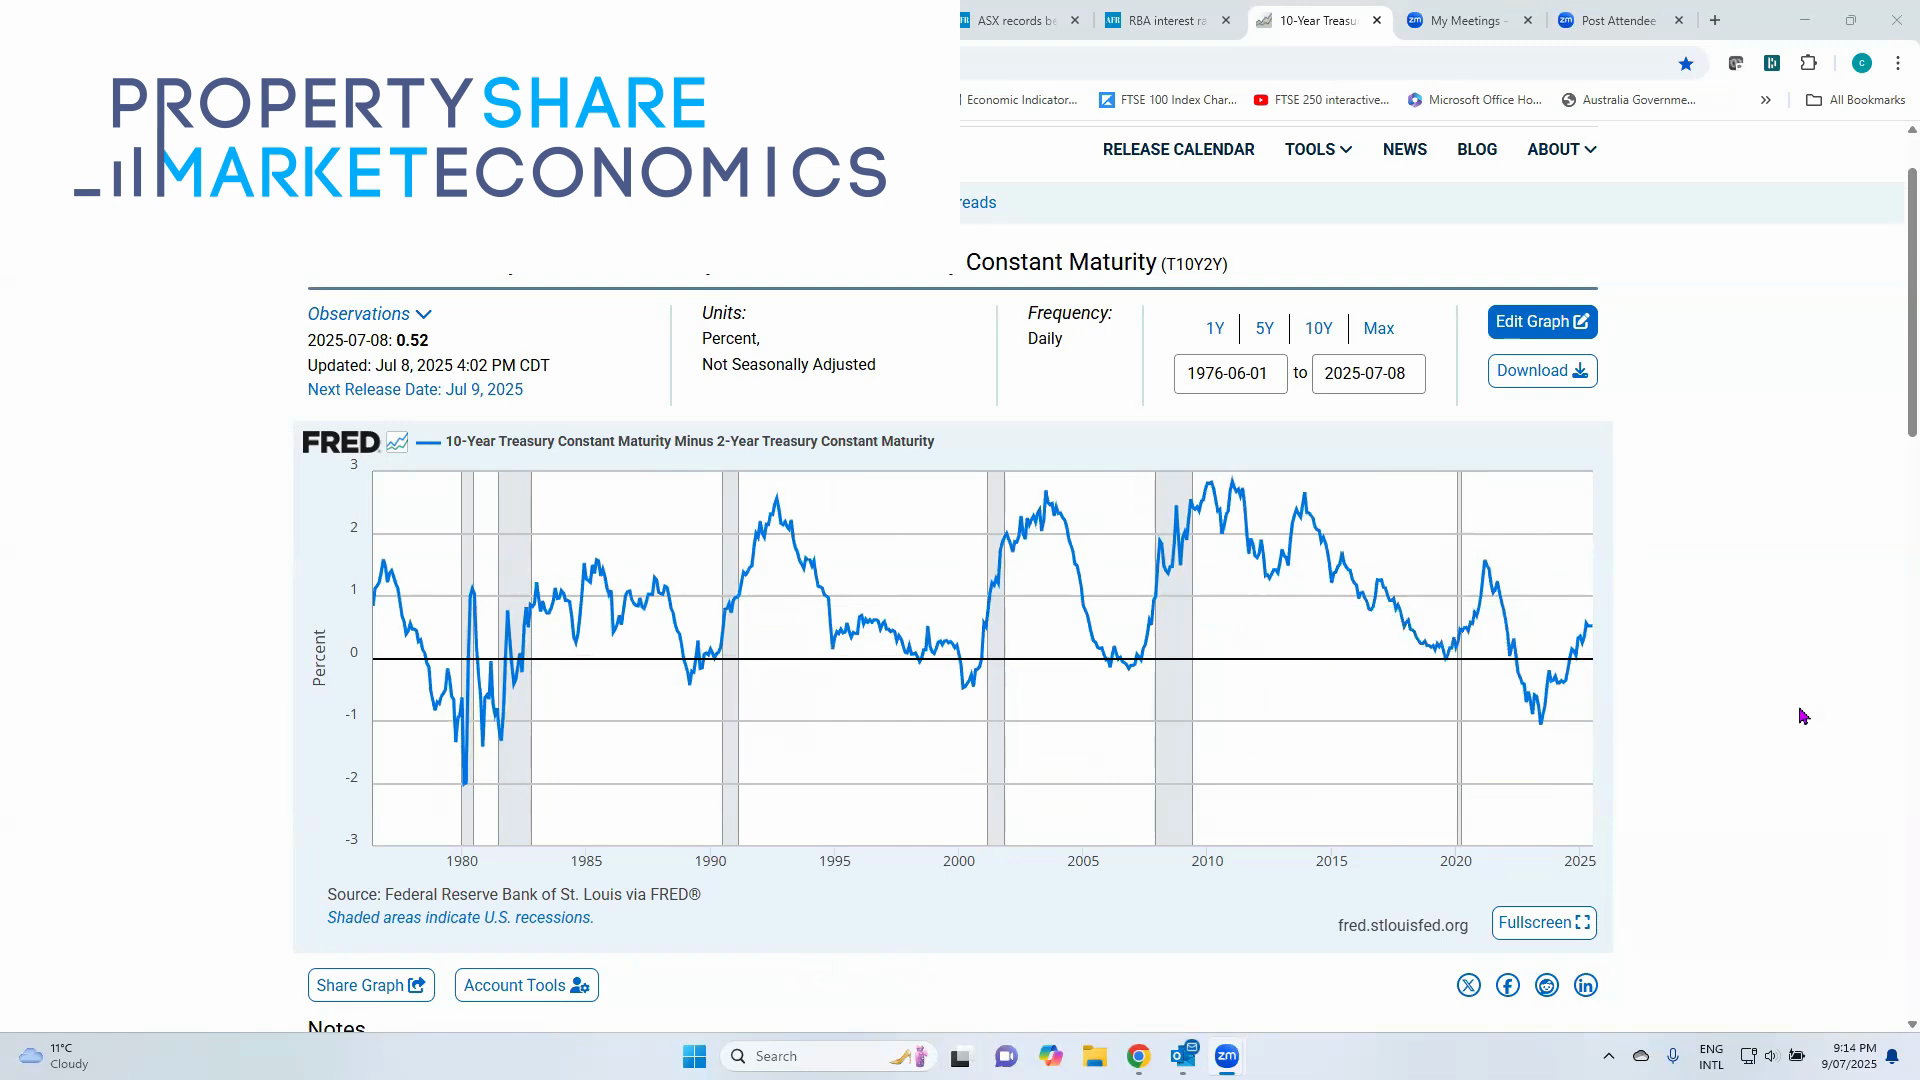 10-Year Treasury constant maturity — long-term interest rate chart for cycle context.
Source: PSE Video
10-Year Treasury constant maturity — long-term interest rate chart for cycle context.
Source: PSE Video
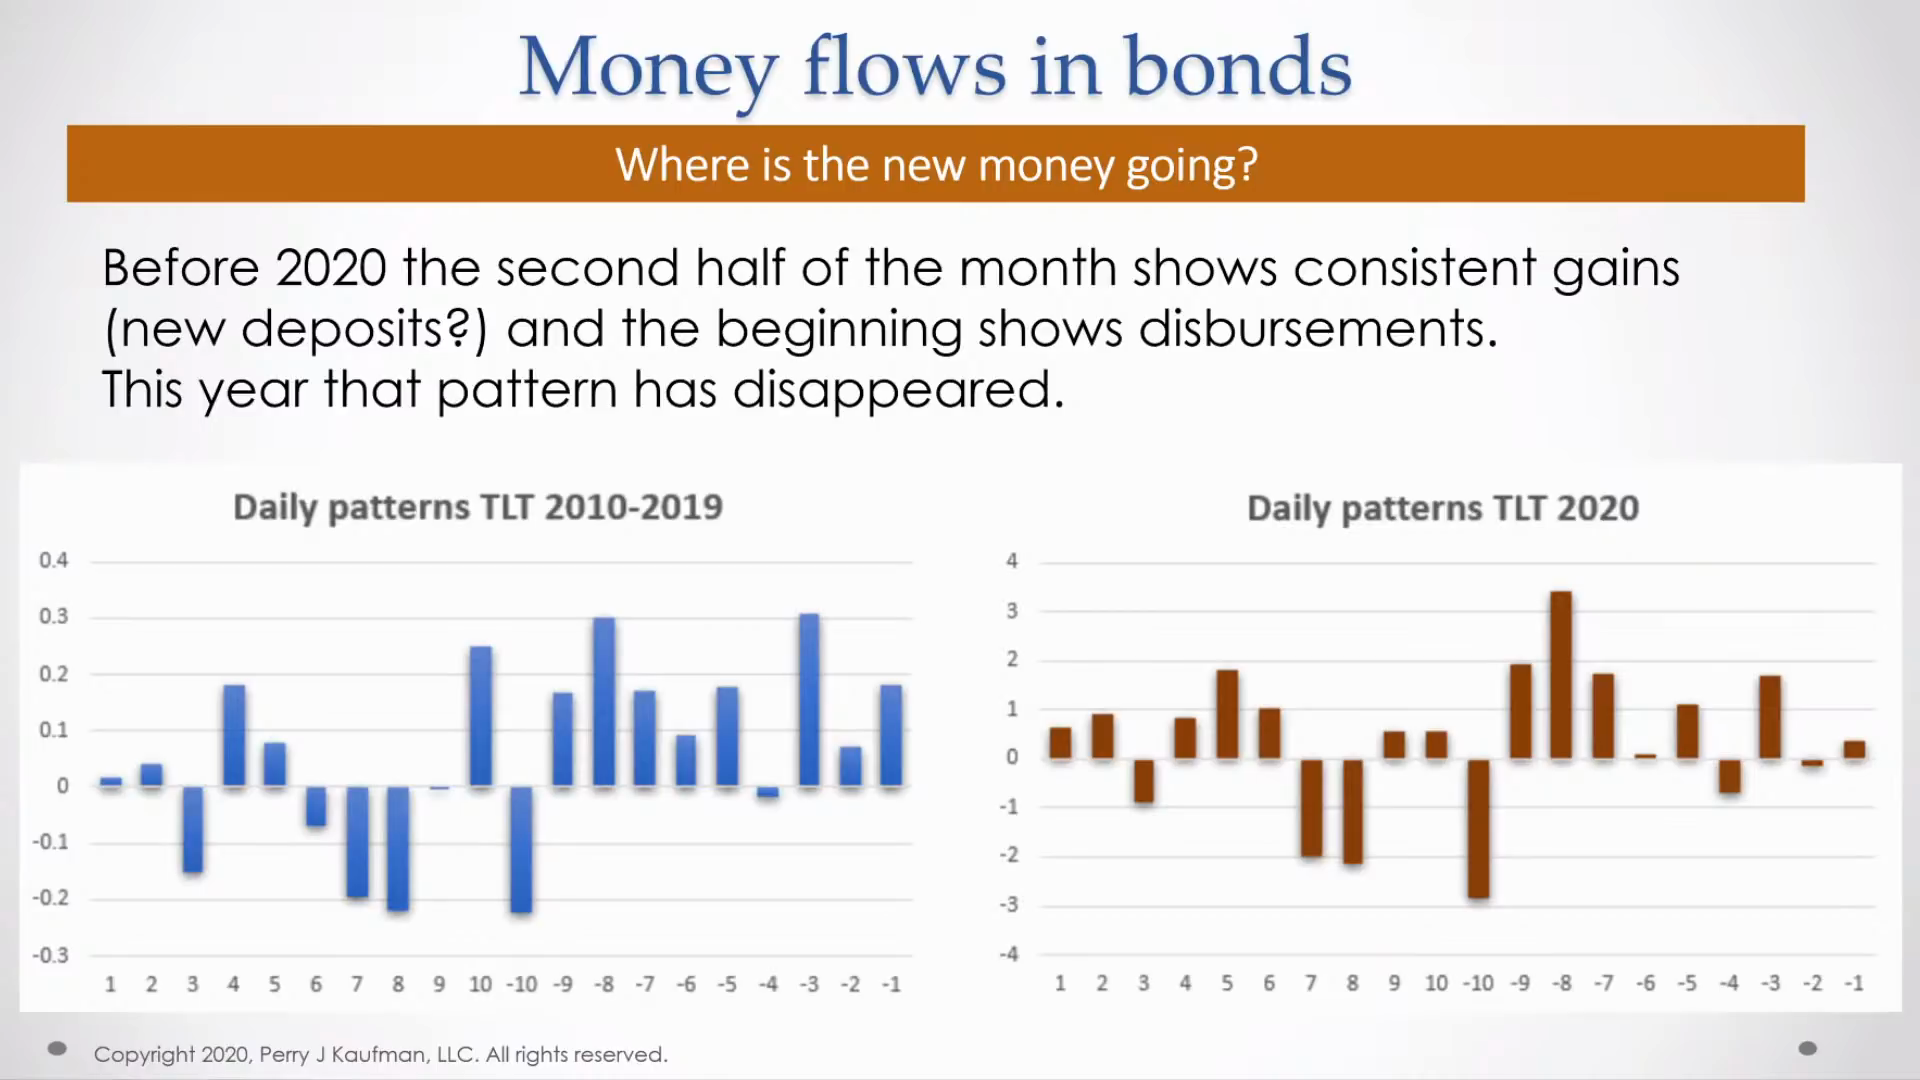 Money flows in bonds — tracking bond market flows against cycle phases.
Source: PSE Video
Money flows in bonds — tracking bond market flows against cycle phases.
Source: PSE Video
 Interest rates and markets — how interest rates interact with the real estate cycle.
Source: PSE Video
Interest rates and markets — how interest rates interact with the real estate cycle.
Source: PSE Video
 Federal Reserve system — PSE context on how Fed policy relates to cycle timing.
Source: PSE Video
Federal Reserve system — PSE context on how Fed policy relates to cycle timing.
Source: PSE Video
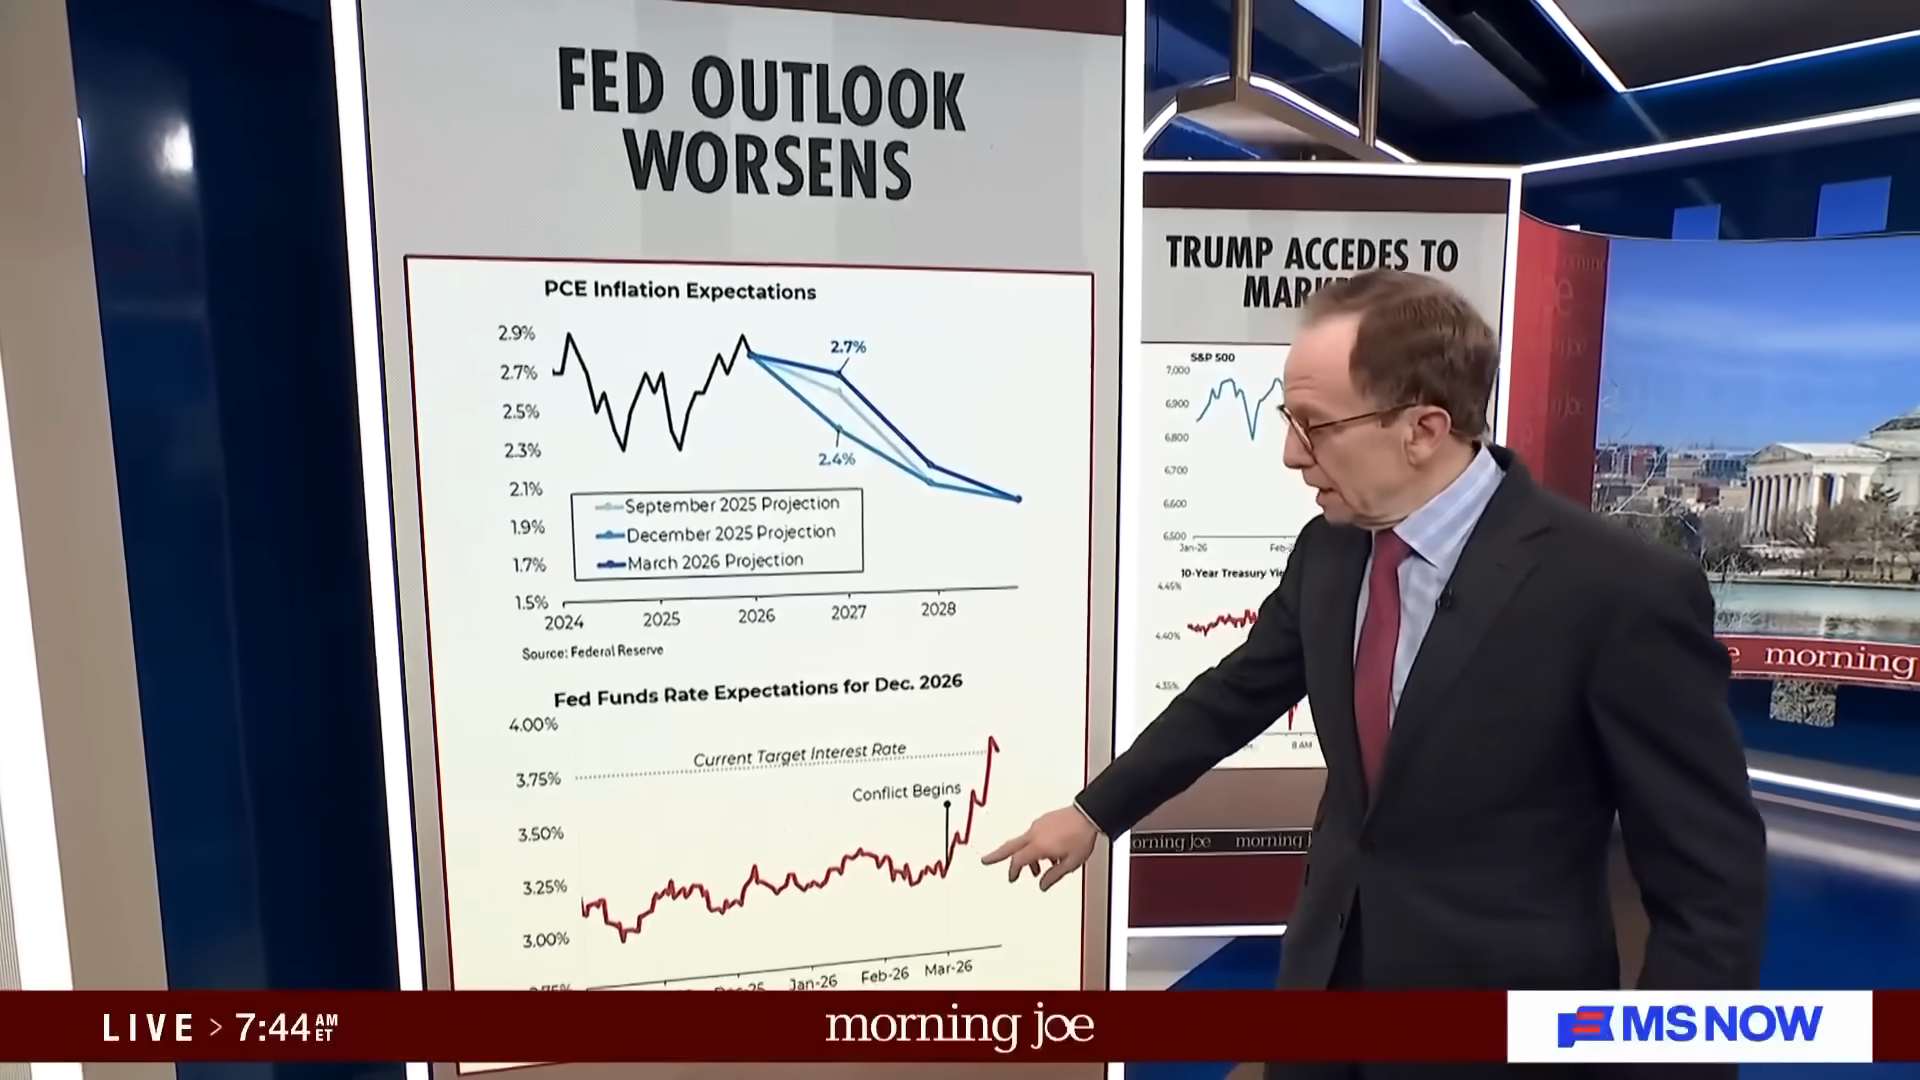 PCE inflation and Fed Funds rate — current cycle inflation/rates comparison chart.
Source: PSE Video
PCE inflation and Fed Funds rate — current cycle inflation/rates comparison chart.
Source: PSE Video