Summary
“14-Up-4-Down” describes the internal asymmetry of the 18.6-year real estate cycle: land prices rise for approximately 14 years, then fall for approximately 4 years. The current cycle started from the 2012 low; PSE projects the up-phase terminating in 2026 (14 years later), followed by a ~4-year downturn bottoming ~2029–2030. The pattern has been studied across US property market data by PSE and is foundational to PSE’s cycle-phase positioning.
Core Claims
- 2026-03-18-14-up (2026-03-18): PSE published a detailed study of the “14 up, 4 down” cycle structure for the US property market. — confidence: high
- 2026-03-18-14-up (2026-03-18): PSE’s cycle structure for the current phase: 14 years up from ~2012, ~4 years down expected thereafter. — confidence: high
- 2026-02-02-bird-flu-timing (2026-02-02): Phil Anderson explicitly stated “14 up, 4 down” as PSE clock structure. — confidence: high
- 2026-01-22-bbi-january-2026 (2026-01-22): “You start with 2012 as the low in the land market…add 14 years…that should give you an indication of where the peak is.” — Akhil Patel — confidence: high
- 2026-03-02-roadmap-cycle-update-february (2026-03-02): “The underlying driver is the peaking of the land cycle, 14 years after it had its lows.” — Phil Anderson — confidence: high
Mechanism / How It Works
- Upswing (~14 years): From cycle low, land prices rise as credit expands, construction picks up, migration/urbanization adds demand, and all productivity gains are capitalized into land rent
- Peak zone (final 2 years): “Winners Curse” phase — speculation intensifies, credit exhausted, land prices unsustainable
- Downturn (~4 years): Credit contraction, bankruptcies, land prices fall; typically a sharper correction than the gradual rise
- New low: Sets the base for the next 14-year upswing
The asymmetry (long rise, short fall) is explained by the gradual nature of credit expansion vs. the rapid seizure of credit markets at cycle end. George Hoyt (1933) and Phil Anderson both observe this rhythm in Chicago land data back to the 1830s.
Historical Instances
| Cycle | Low | Peak | Duration Up | Downturn | Notes |
|---|---|---|---|---|---|
| Prior | ~1990 | ~2006–07 | ~16 yrs | ~2009–12 | GFC; US housing collapse |
| Prior | ~1973–74 | ~1989 | ~15 yrs | ~1990–92 | S&L crisis; Japanese crash |
| Prior | ~1955 | ~1973 | ~18 yrs | ~1973–75 | Oil shock (symptom) |
| Current | 2012 | ~2026 | ~14 yrs | ~2026–30 | Cycle in progress |
The current cycle’s 14-year duration is at the shorter end of historical range, partly attributed to the mid-cycle COVID slowdown (2020) which was not a full-cycle end.
PSE Report (2026)
Phil Anderson promoted PSE’s March 2026 report as a definitive study of the “14 up, 4 down” cycle in US property markets. The report includes:
- Updated charts with historical timing
- Confirmation of the current cycle structure
- Addendum with 2026 implications The PSE report is referenced as “the latest report on the 18.6-year property cycle, including updated charts, historical timing, and what it may signal for 2026.”
Applications
- Cycle timing: Know which phase you’re in; calibrate risk accordingly
- Entry windows: Buy near the 4-year low; hold through the 14-year upswing
- Exit windows: Reduce exposure in years 13–14 (current: 2025–2026)
- Don’t confuse mid-cycle corrections (2020 COVID, 2022 rate shock) with cycle end
Contradictions & Open Questions
- Phil Anderson maintains the cycle peak has not yet occurred as of March 2026; yet Bitcoin crashed 50% from its October 2025 high, suggesting liquidity may have peaked earlier
- The 14-year count from 2012 points precisely to 2026; but some sources suggest 2027 if counting from different lows
- The “4-year” downturn is approximate; the prior downturn (2008–2012) was closer to 4–5 years
Related Concepts
Visual Evidence
Slides illustrating the 14-up-4-down structure of the real estate cycle with historical data.
 Four phases of the 18-20 year cycle — showing the 14-year expansion and 4-year contraction.
Source: 2022-10-01-bbi-gold-coast-session-part-2
Four phases of the 18-20 year cycle — showing the 14-year expansion and 4-year contraction.
Source: 2022-10-01-bbi-gold-coast-session-part-2
 18-20 year cycle with phase annotations — full cycle structure with duration markers.
Source: 2022-10-01-bbi-gold-coast-session-part-2
18-20 year cycle with phase annotations — full cycle structure with duration markers.
Source: 2022-10-01-bbi-gold-coast-session-part-2
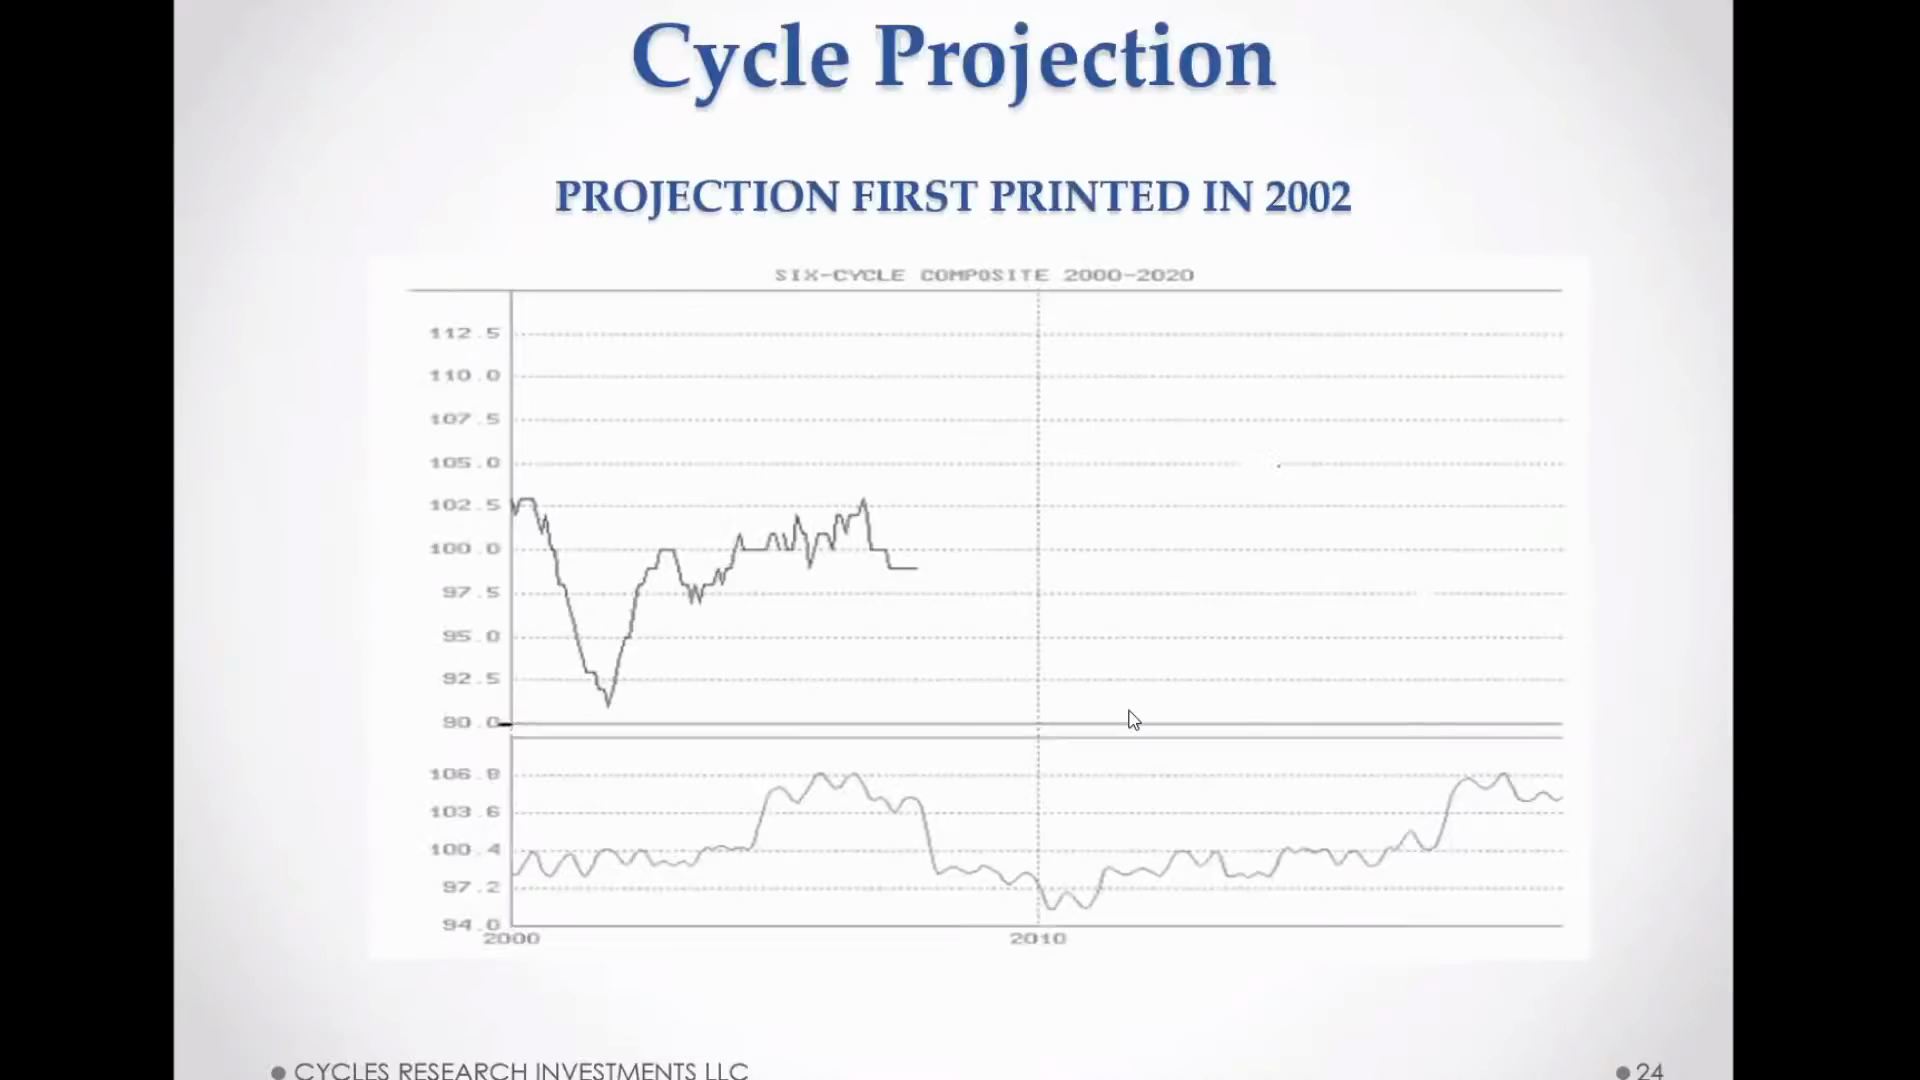
 18-year real estate cycle — comprehensive explanation with duration stats.
Source: PSE Video
18-year real estate cycle — comprehensive explanation with duration stats.
Source: PSE Video
 Cycle description slide — key claims about the 14-up-4-down pattern.
Source: PSE Video
Cycle description slide — key claims about the 14-up-4-down pattern.
Source: PSE Video
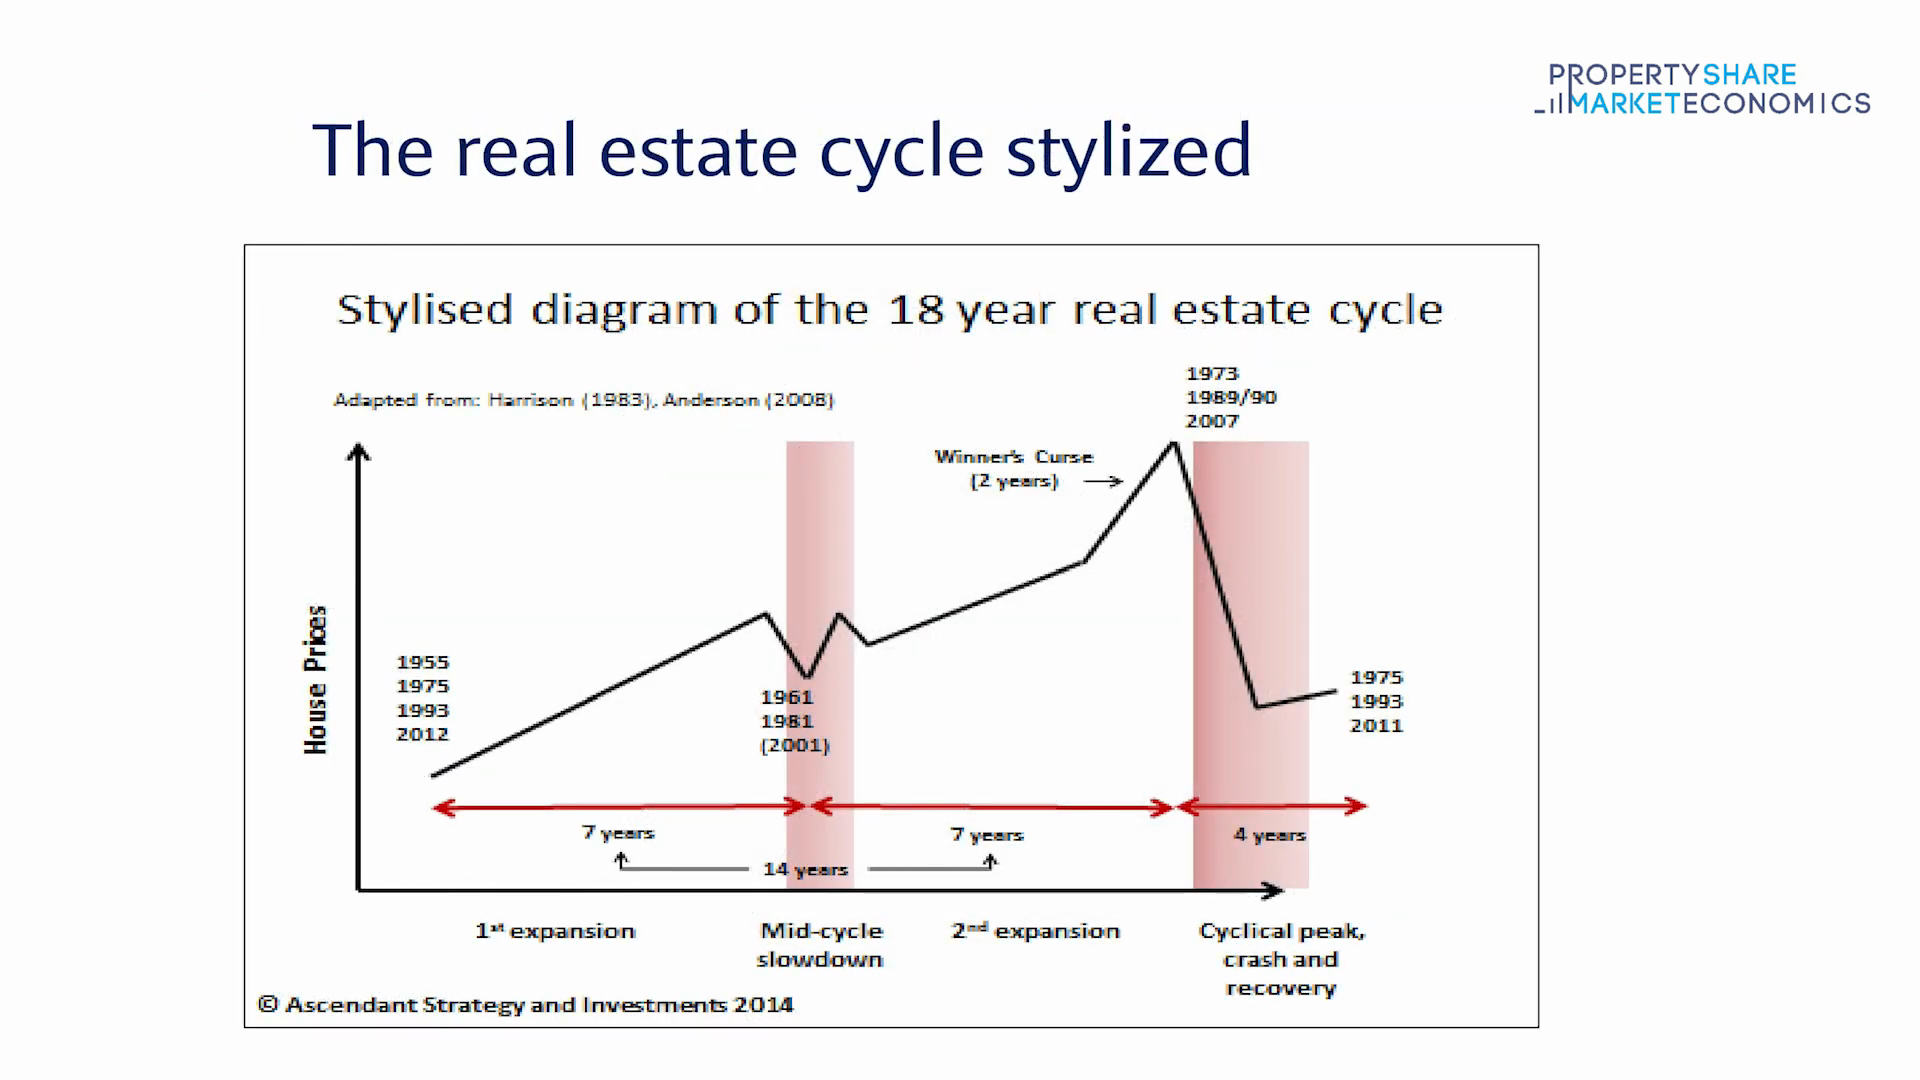 Real estate cycle chart — visual showing the asymmetric up/down structure.
Source: 2022-10-01-bbi-gold-coast-session-part-1
Real estate cycle chart — visual showing the asymmetric up/down structure.
Source: 2022-10-01-bbi-gold-coast-session-part-1
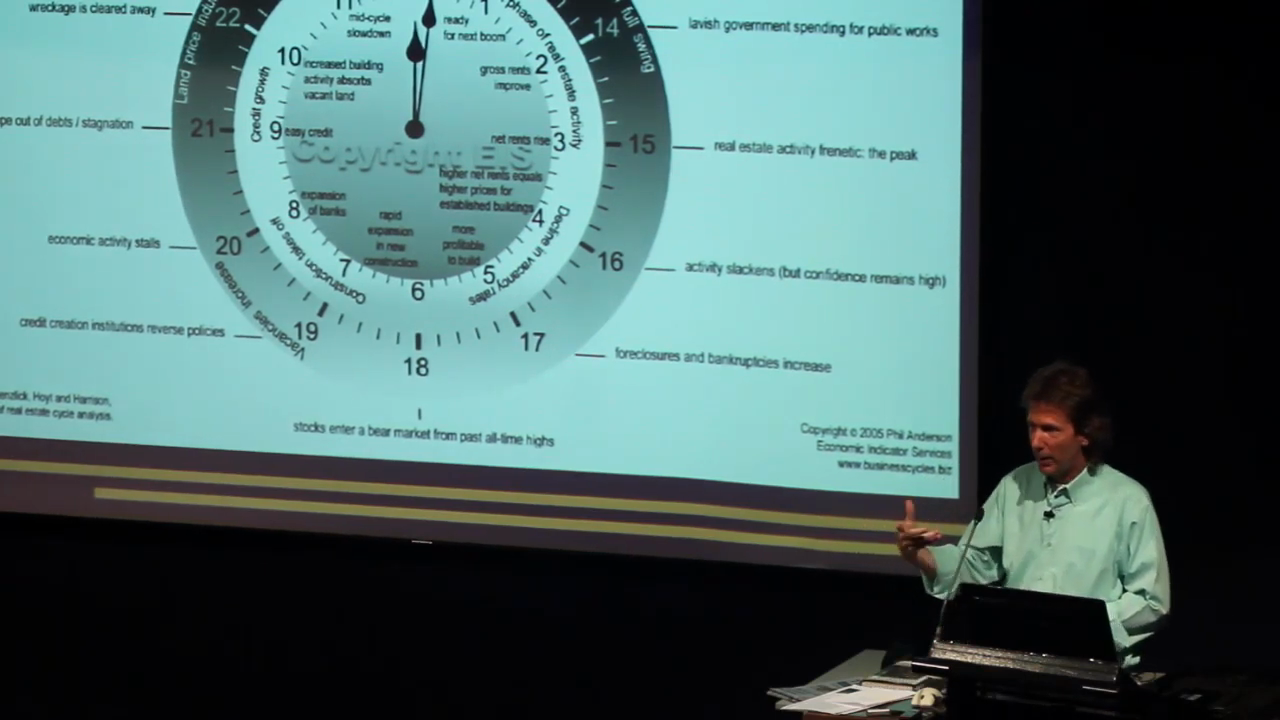 Economic stages — the four stages of the cycle including the long recovery phase.
Source: PSE Video
Economic stages — the four stages of the cycle including the long recovery phase.
Source: PSE Video