Summary
In PSE’s framework, geopolitical conflict is not a cause of economic cycles — it is a predictable symptom. Geopolitical tensions escalate in the second half of the 18.6-year real estate cycle, particularly as the K-Wave (Kondratieff Wave) peaks. Major powers compete for access to economic rent (oil, land, resources) dressed up as ideological conflict. Gann identified recurring geopolitical patterns on 7, 30, 60, 80, 100, and 210-year intervals. PSE tracks these cycles as timing tools, not to predict specific wars but to confirm cycle position and warn of escalating volatility.
Core Claims
- 2022-01-01-bbi-january-2022 (2022-01-01): Historical geopolitical events affecting Russia/Ukraine cluster at Gann-significant intervals from 2021/22: USSR formation 100 years (1922), Berlin Wall 30 years (1961/91), Babi Yar 80 years (1941), Ukrainian revolution 7 years/90 months (2014), Cuba crisis 60 years (1962), Napoleon 1812 campaign 210 years. — confidence: medium
- 2026-03-31-roadmap-update-march (2026-03-31): “Those without our 18.6-year cycle framework often mistake surface events for principal causes. The same error was made in 1973–75, when the crisis was attributed to the ‘Oil Shock’.” — Phil Anderson — confidence: high
- Multiple sources: The current geopolitical cycle is K-wave consistent; peak with major power conflict expected as K-wave peaks around 2026–2027. — confidence: high
- 2026-01-12-us-dollar-venezuela (2026-01-12): Iran targeted after Venezuela — geopolitical expansion follows economic rent capture logic. — confidence: high (Iran war began Feb 28, 2026 — confirmed)
- 2026-02-26-bbi-february-2026 (2026-02-26): Middle East conflict in second half of real estate cycle is historically consistent; amplified this cycle by K-Wave peak coincidence. — confidence: high
- 2026-05-11-book-launch-fred-harrisons-cheating (2026-05-11): Harrison predicts five major crises (political gridlock, environmental collapse, mass migration, authoritarianism, uncontrolled AI) converging ~2028 — as cycle enters post-peak phase. — confidence: medium
- Phil Anderson (1995, cited 2022): “I wrote my K-Wave document back in 1995, 30 years ago. I’ve been quite clear for several decades that we’d get a massive arms buildup into 2026.” — confidence: high
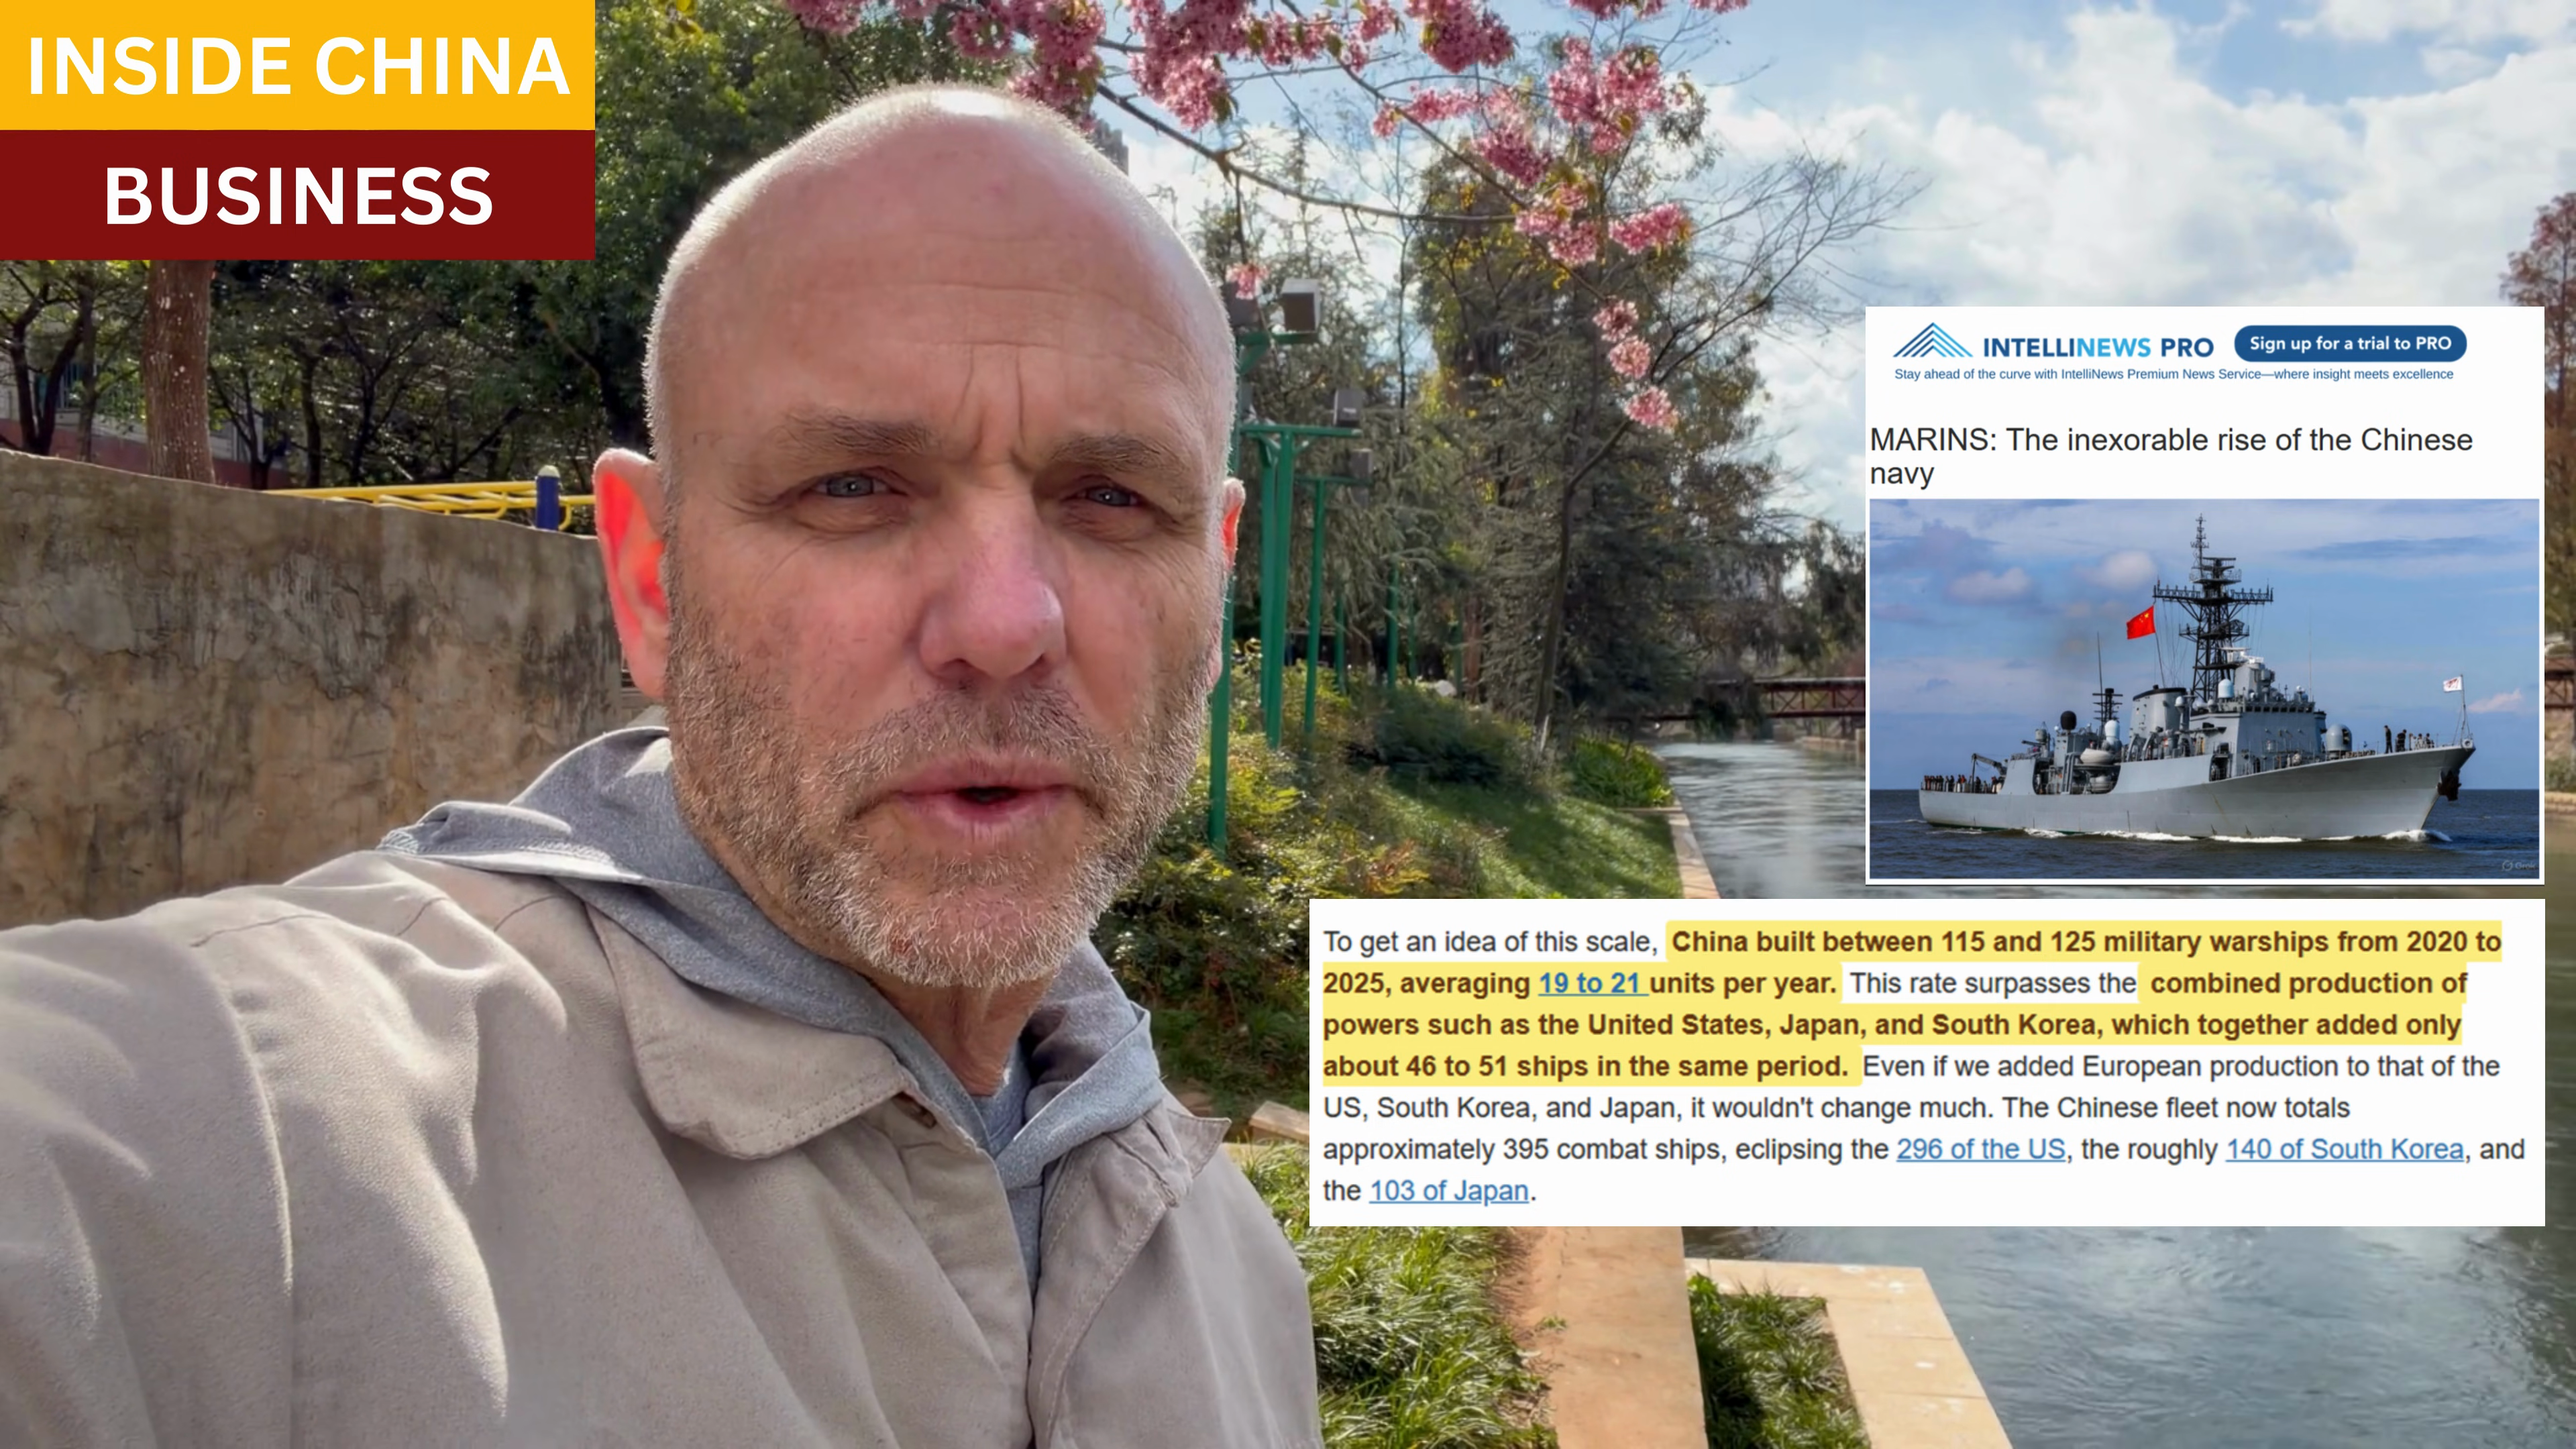
- 2026-06-05-bbb-postcard-36-ai-media (2026-06-05): Darren Wilson maps US–China geopolitical interdependence directly onto the AI supply chain: China controls the rare-earth bottleneck (Bayan Obo mine, gallium nitrate, heavy REEs under export controls since April 2025 Liberation Day tariffs); transformer / gas-turbine / data-centre hardware flows from China to the US (8,000 transformers imported); China has more renewable energy installed than the EU, UK, and US combined. The Pentagon’s recent direct equity stakes in rare-earth miners follow 15 years of failed indigenisation efforts. Wilson’s conclusion: “in 10 years they may not need the West at all.” — Darren Wilson — confidence: high
Mechanism / How It Works
Why Geopolitics Follows the Cycle
- Economic rent competition: Wars are ultimately about controlling rent-producing assets (oil, land, strategic routes, mineral rights)
- Second-half-of-cycle pattern: As the cycle peaks, major powers are most indebted and most desperate to control resources → conflicts escalate
- K-wave convergence: Kondratieff Wave peaks (every ~50–60 years) coincide with the most severe geopolitical crises (WWI, WWII, Cold War peak)
- Manufactured narratives: PSE argues media portrays geopolitical conflicts as ideological/moral to obscure the underlying rent/resource basis
Gann’s Cycle Intervals Applied to Geopolitics
Gann identified these recurrence patterns:
- 7-year cycle (90 months): Short political/market cycles
- 30-year cycle (Saturn Return): Generation-scale recurrences
- 60-year cycle (2 Saturn Returns): Long economic wave
- 80–84-year cycle (Uranus cycle): Constitutional/civilizational shifts
- 100-year cycle: Century-scale empires and power transitions
- 210-year cycle (7 × 30): Very long historical patterns
Application: The current Ukraine conflict (2022–) has echoes at each interval going back to 1812 (Napoleonic), 1922 (Soviet formation), 1962 (Cuba crisis), 2014 (Ukrainian revolution).
The 2026 US-China AI Interdependence Layer
Darren Wilson’s BBB Postcard #36 (5 June 2026) extends the rent-capture / manufactured-enemy frame into the AI supply chain. The geopolitical conflict at this cycle peak is not just over oil and territorial rents (as in the Iran/Venezuela cases) but is now plumbed through the technological infrastructure: rare-earth elements, electrical transformers, gas turbines, and the chips and data-centre hardware that ride on them. China holds the structural choke points on all four. This means escalations between Washington and Beijing now propagate directly into US-listed AI equity valuations (see AI Bubble Thesis) — the geopolitical cycle and the cycle’s defining bubble are physically coupled, in a way the dot-com or 2007 securitisation peaks were not. Wilson’s working conclusion is that interdependence will eventually force cooperation, but if it does not, China is positioned to be technologically self-sufficient within roughly a decade, which would re-order the K-wave’s downside path.
The “Manufactured Enemy” Pattern
Phil Anderson argues that major Western powers systematically create/amplify enemy narratives to justify rent extraction:
- Post-Cold War sequence: USSR → Terrorism → China
- Each “enemy” justifies military spending (which benefits land/resource owners)
- Venezuela, Iran: destroyed to secure oil rent access; justified via “democracy/human rights” narrative
- China “military threat”: described by Phil (2018) as a manufactured second-half-cycle narrative
Historical Geopolitical Cycle Instances
| Cycle Position | Period | Conflict | K-Wave Status |
|---|---|---|---|
| K-Wave peak | 1914–1918 | WWI | Peak |
| K-Wave peak | 1939–1945 | WWII | Re-peak / Winter |
| K-Wave Winter | 1950–1953 | Korean War | Decline |
| K-Wave peak | 1965–1975 | Vietnam War | Peak |
| K-Wave transition | 1979–1991 | Cold War final phase | Decline |
| K-Wave trough | 2001–2010 | War on Terror | Trough/Early Spring |
| K-Wave peak | 2022–? | Ukraine, Iran/Middle East | Peak |
The Iran War (February 28, 2026)
Phil Anderson used the US-Israel attack on Iran (Feb 28, 2026) as a key Gann anchor date:
- 30/60/90 day counts forward → April, May, June 2026 key windows
- Oil price surge from Strait of Hormuz disruption: ~20% of global petro-liquids transit
- Risk: new inflation wave → Fed hawkish → credit tightening → cycle brought forward
- DXY fell sharply; gold surged; commodity ETF (GSG) broke out above Mexican Pete pattern at $24
Role of Economic Rent in Geopolitics
Core PSE thesis: understanding Henry George’s concept of economic rent is essential for understanding geopolitics.
- Venezuela: Oil nationalization instead of Georgist rent taxation — US destroyed it; a Georgist land tax would have prevented this
- Iraq, Libya, Afghanistan: Rent-producing territory / oil access control
- US Dollar Hegemony: The ultimate geopolitical rent mechanism — US maintains demand for USD as oil currency, extracting seigniorage rent globally
Timing Implications
- Arms buildup into 2026: Phil predicted this in 1995 K-Wave document; confirmed by current military spending surge
- Post-2026: “Years after 2026 will bring violent political upheaval, floods/droughts, and far-right extremism” — Phil Anderson (October 2023)
- Uranus in Gemini 2025–2032: Every transit has coincided with US at war; currently confirmed (Iran war)
- K-wave winter characteristics: Debt deflation, currency crises, geopolitical conflict, social upheaval
Applications
- Treat geopolitical news as cycle confirming, not cycle causing
- Use Gann interval counts from major geopolitical events as timing markers
- Watch commodity prices (oil, copper) during geopolitical escalation — late-cycle amplifier
- Geopolitical conflict at K-wave peak = heightened post-cycle downturn severity
- Don’t make portfolio decisions based on geopolitical outcomes — make them based on cycle position
Contradictions & Open Questions
- PSE’s “geopolitics = manufactured” thesis is strongly ideological; some genuine security concerns may not be rent-motivated
- The Gann interval approach (7, 30, 60, 80, 100, 210 years) can find patterns in any historical sequence — risk of spurious pattern-matching
- Does the K-wave actually cause geopolitical escalation, or are they both driven by a third variable (economic stress)?
- War in 1914/1939 prevented normal cycle downturns — could current conflicts similarly distort/delay the 2026 downturn?
Related Concepts
- kondratieff-wave
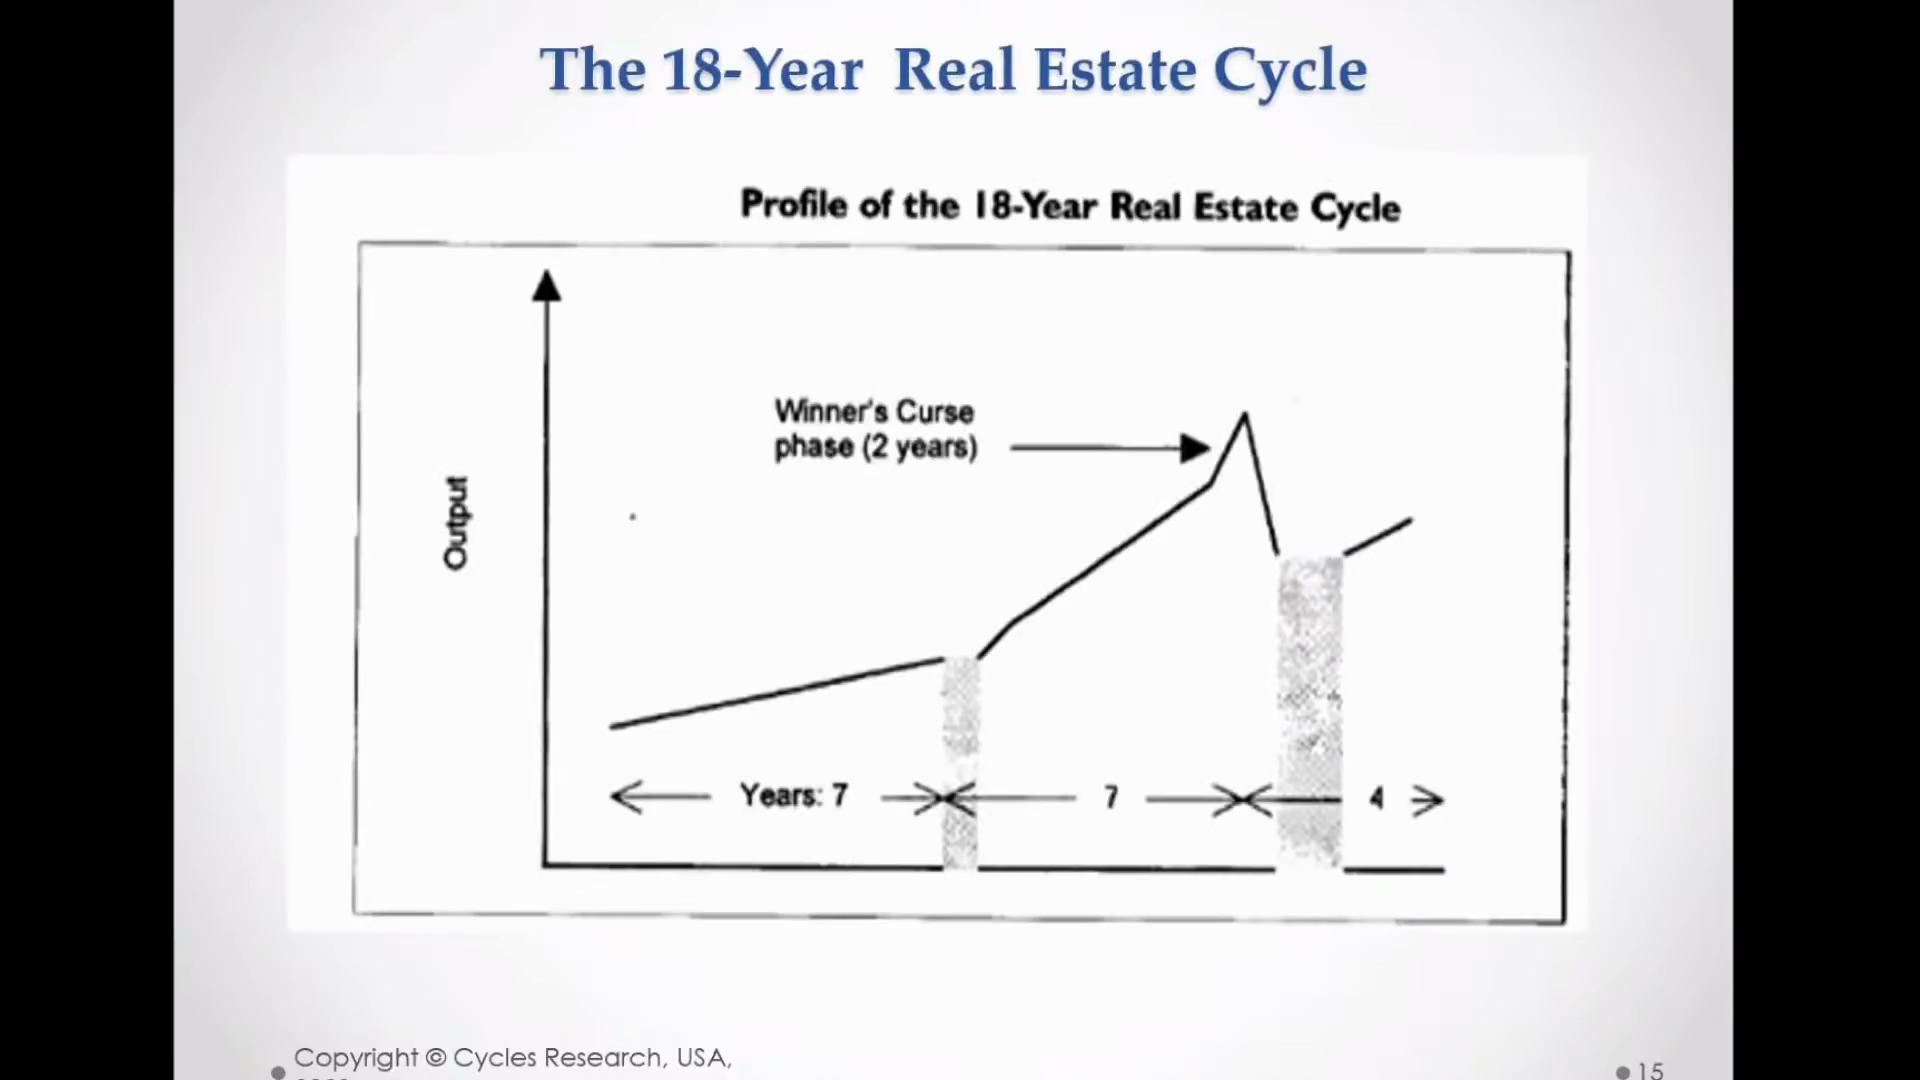
- 18-6-year-real-estate-cycle
- us-dollar-hegemony
- economic-rent
- planetary-cycles
- commodity-supercycle
- ai-bubble-thesis — the 2026 cycle’s defining bubble is now physically coupled to US-China geopolitical risk via rare earths, infrastructure, and energy.
Visual Evidence
Slides from PSE video content illustrating geopolitical cycles, war timing, and empire cycles.
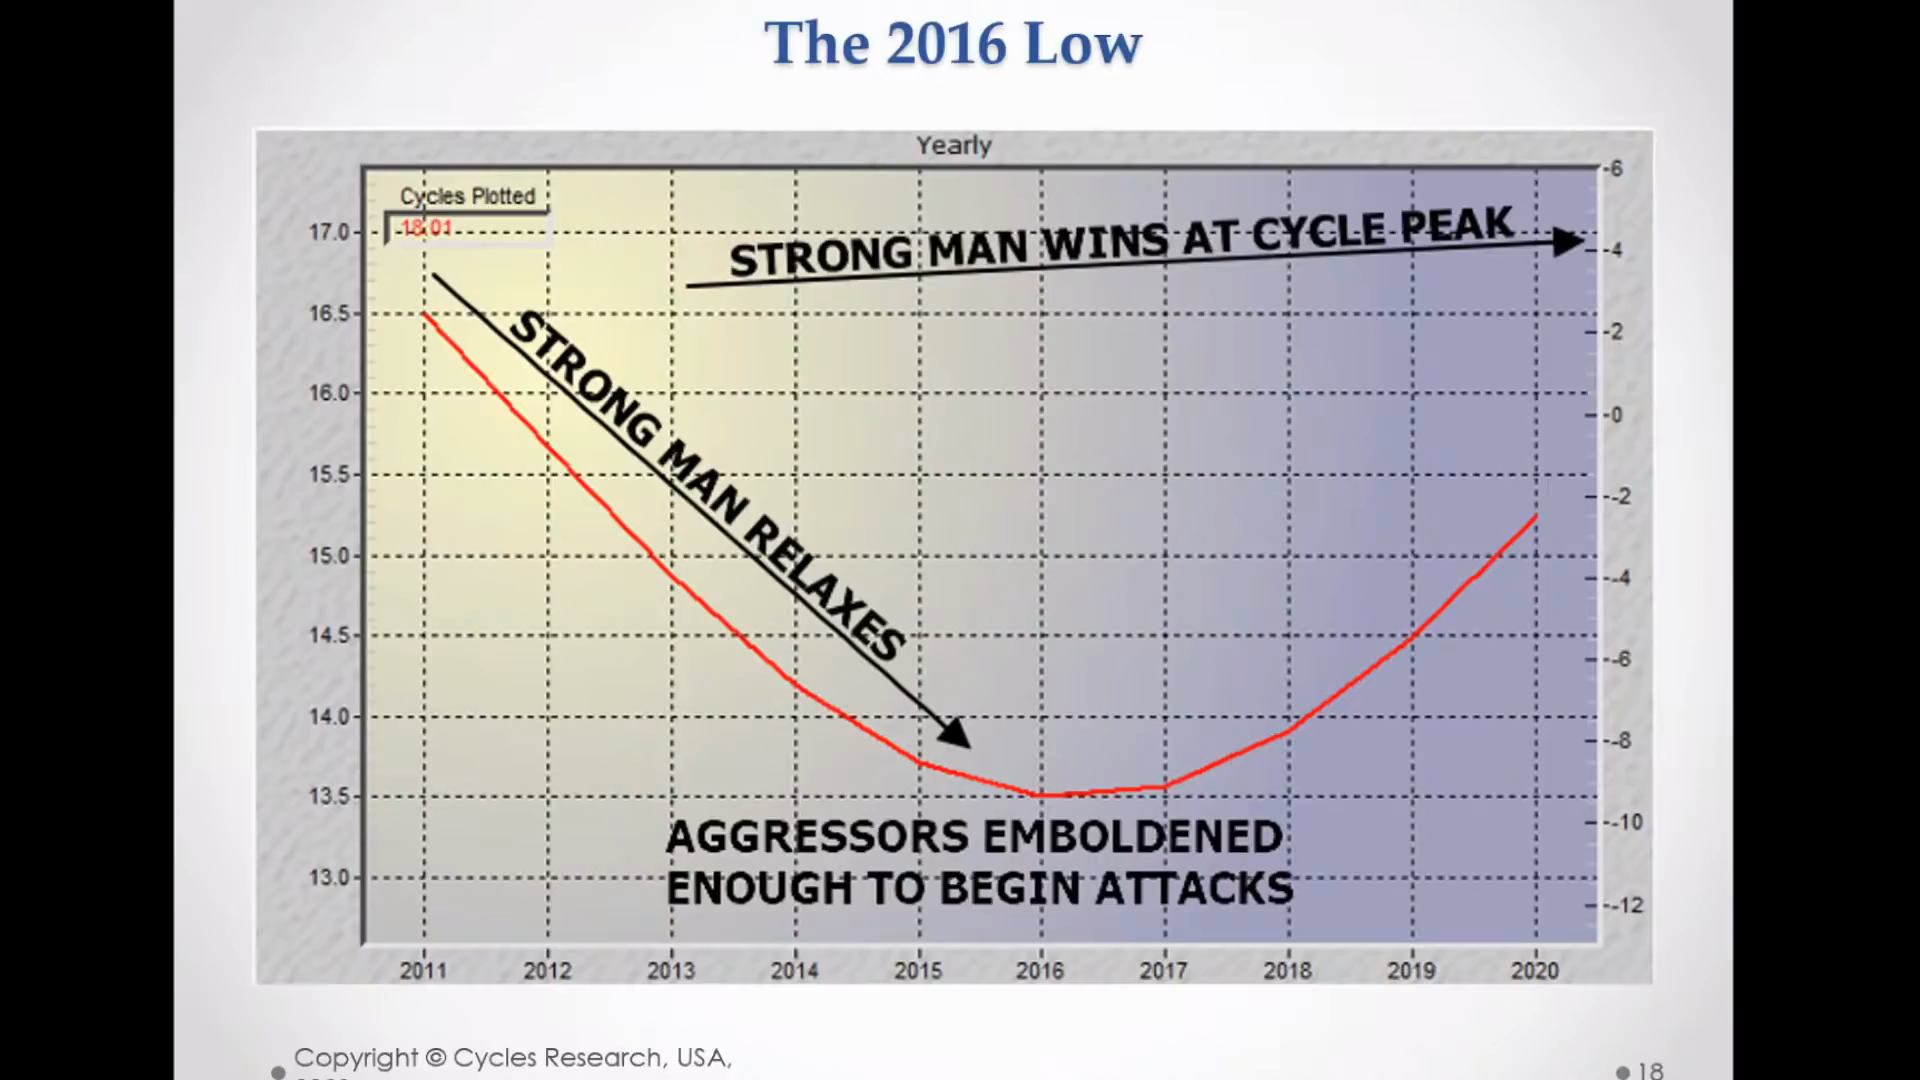 Wheeler’s War Cycle — graph showing historical war cycle patterns and peak periods.
Source: PSE Video
Wheeler’s War Cycle — graph showing historical war cycle patterns and peak periods.
Source: PSE Video
 Wheeler’s war cycle diagram — visual of the Raymond Wheeler war cycle framework.
Source: PSE Video
Wheeler’s war cycle diagram — visual of the Raymond Wheeler war cycle framework.
Source: PSE Video
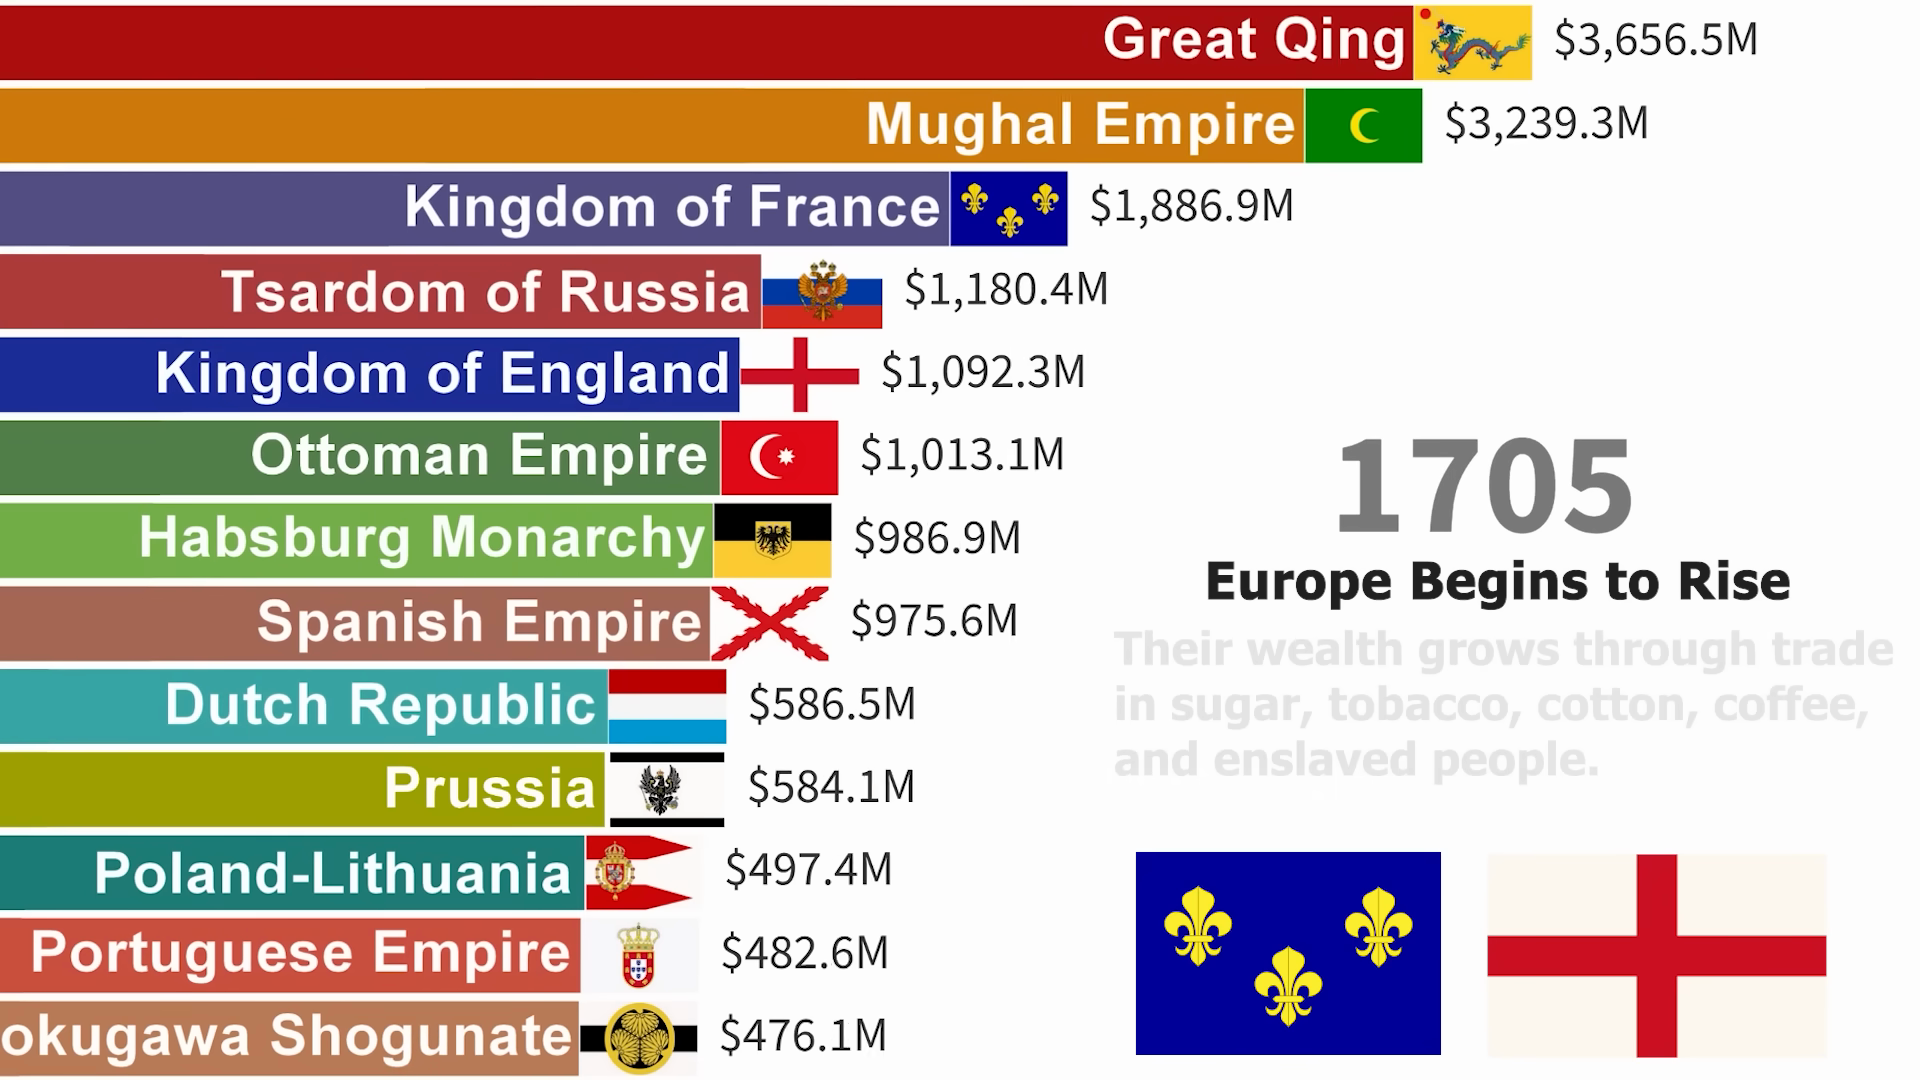 Most powerful empires chart — long-term geopolitical power cycle across history.
Source: PSE Video
Most powerful empires chart — long-term geopolitical power cycle across history.
Source: PSE Video
 BRICS nations map — geopolitical realignment and the end of US unipolar dominance.
Source: PSE Video
BRICS nations map — geopolitical realignment and the end of US unipolar dominance.
Source: PSE Video
 EU Aid to Ukraine vs Russia imports — geopolitical conflict mapped to economic data.
Source: PSE Video
EU Aid to Ukraine vs Russia imports — geopolitical conflict mapped to economic data.
Source: PSE Video
 China vs US GDP comparison — the shifting geopolitical economic balance.
Source: PSE Video
China vs US GDP comparison — the shifting geopolitical economic balance.
Source: PSE Video
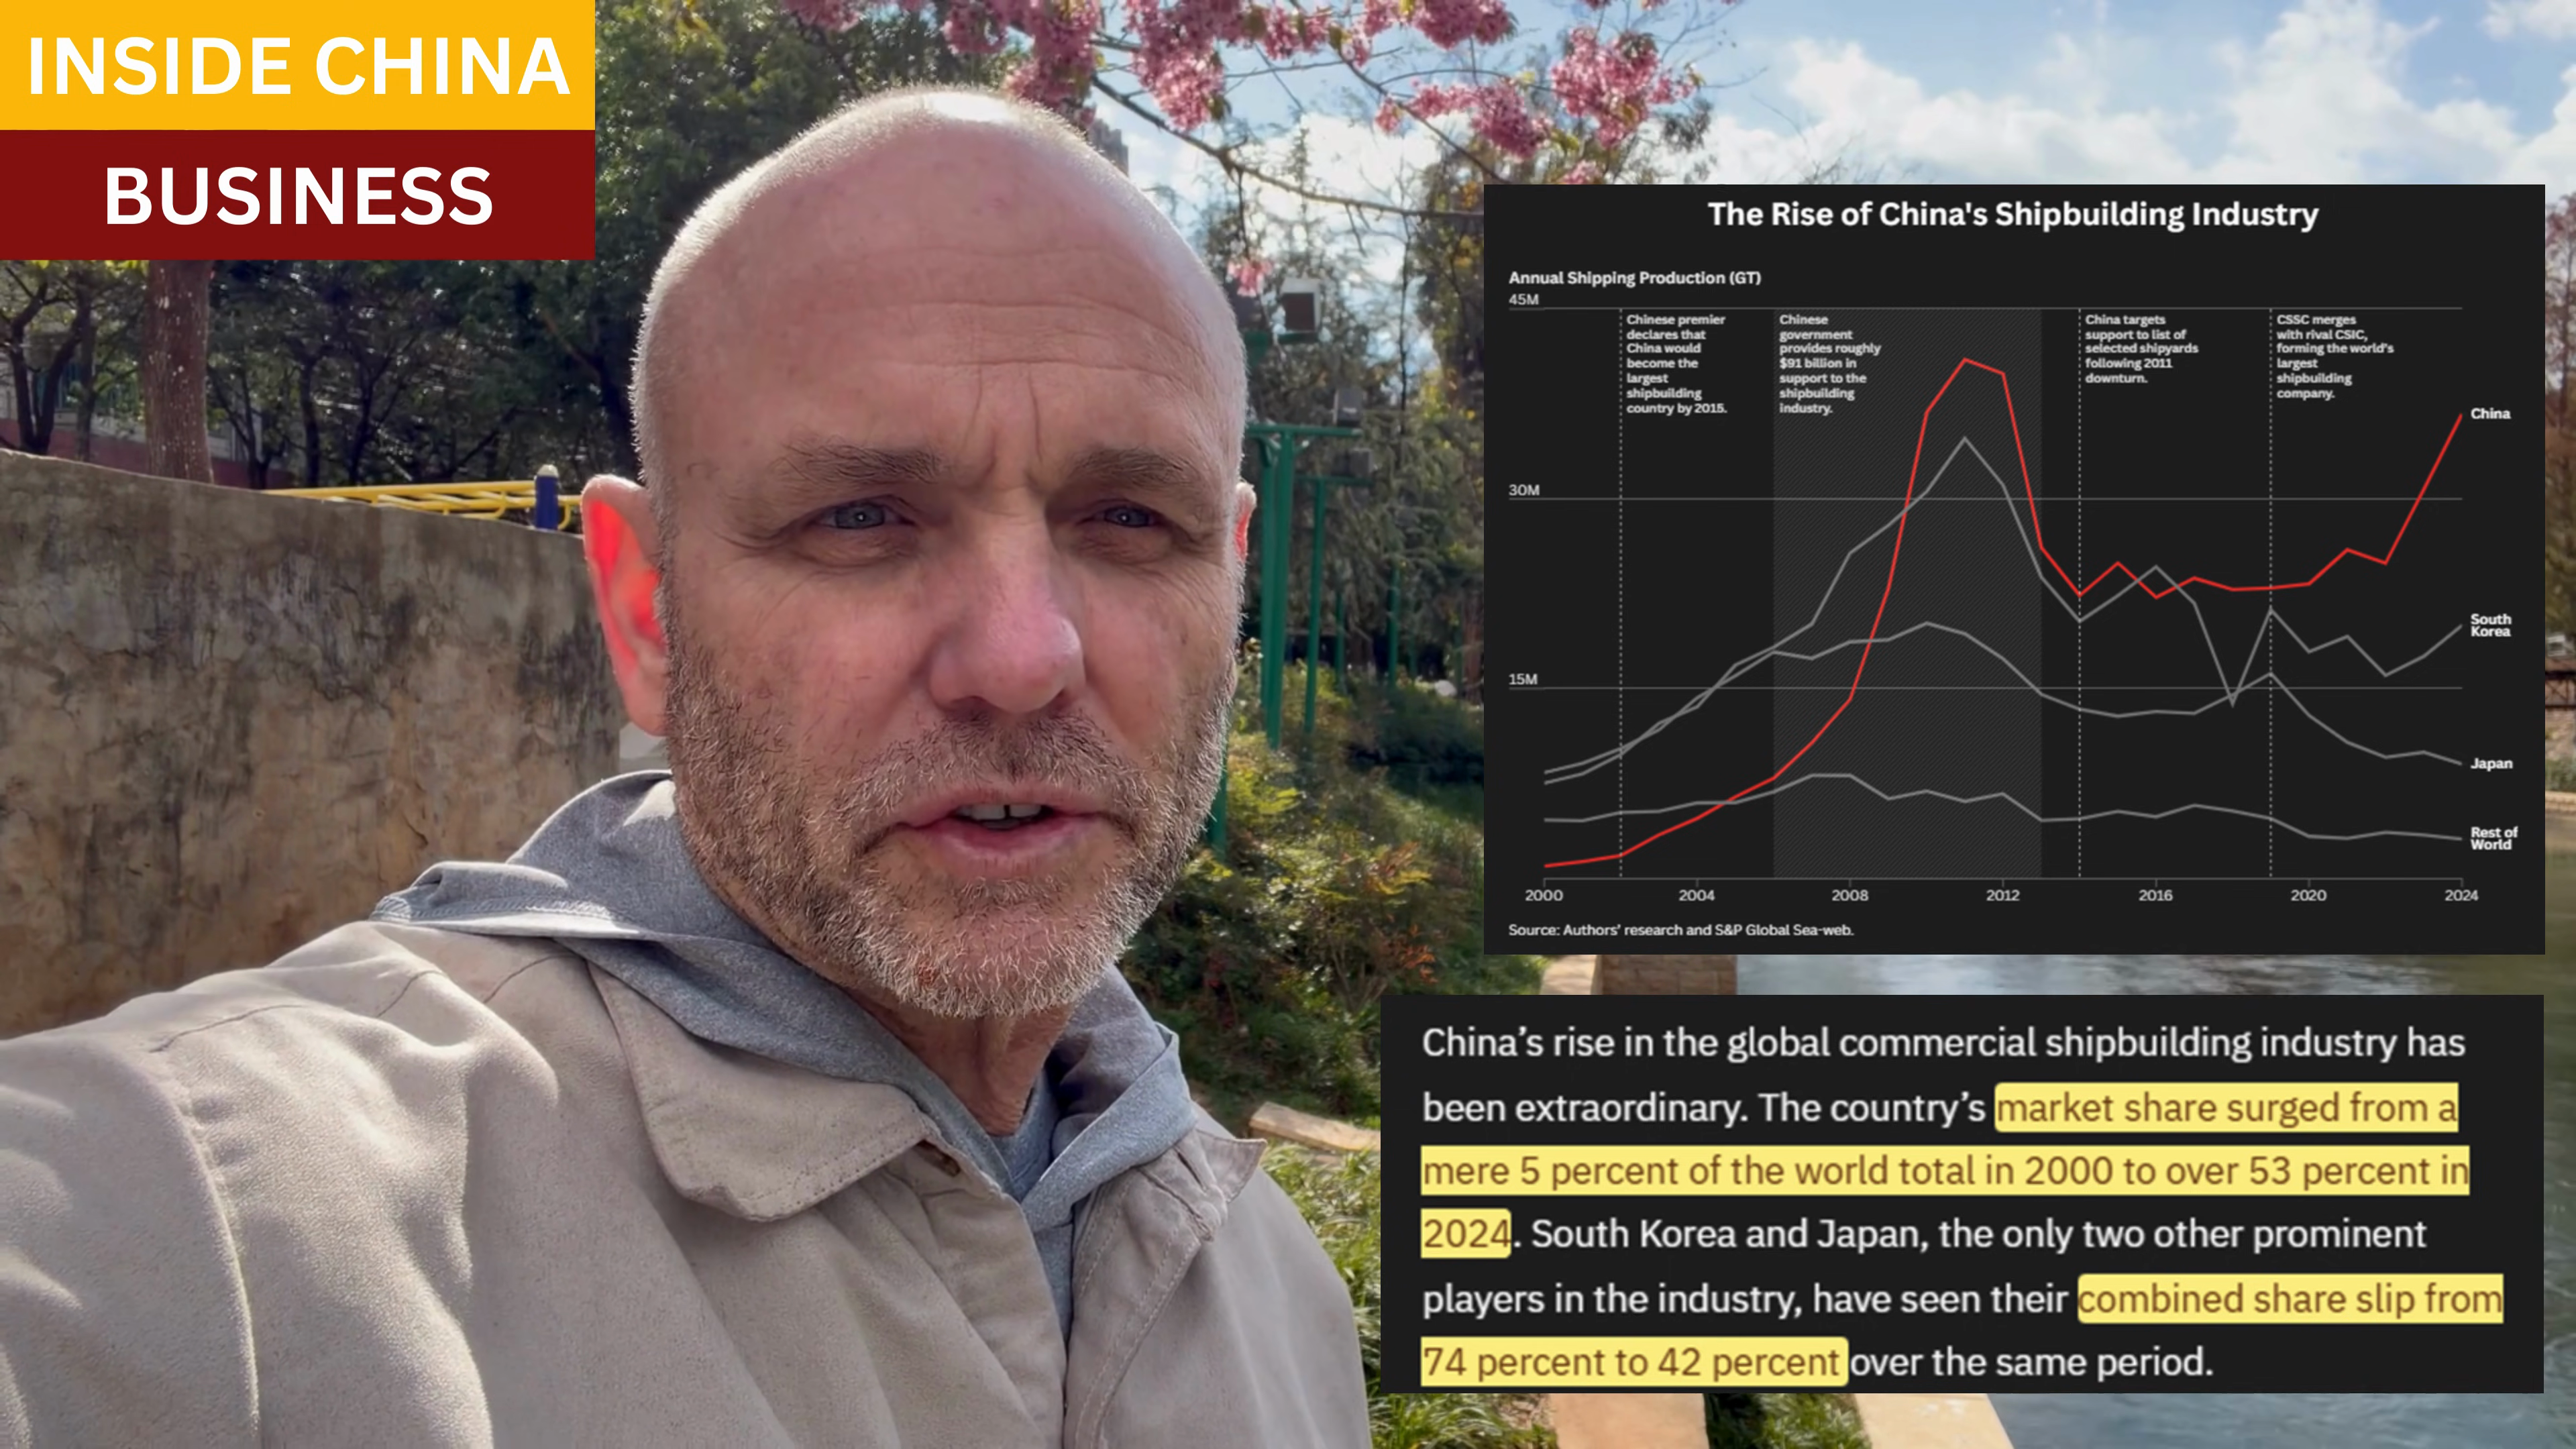 China’s shipbuilding — industrial capacity as a geopolitical cycle indicator.
Source: PSE Video
China’s shipbuilding — industrial capacity as a geopolitical cycle indicator.
Source: PSE Video
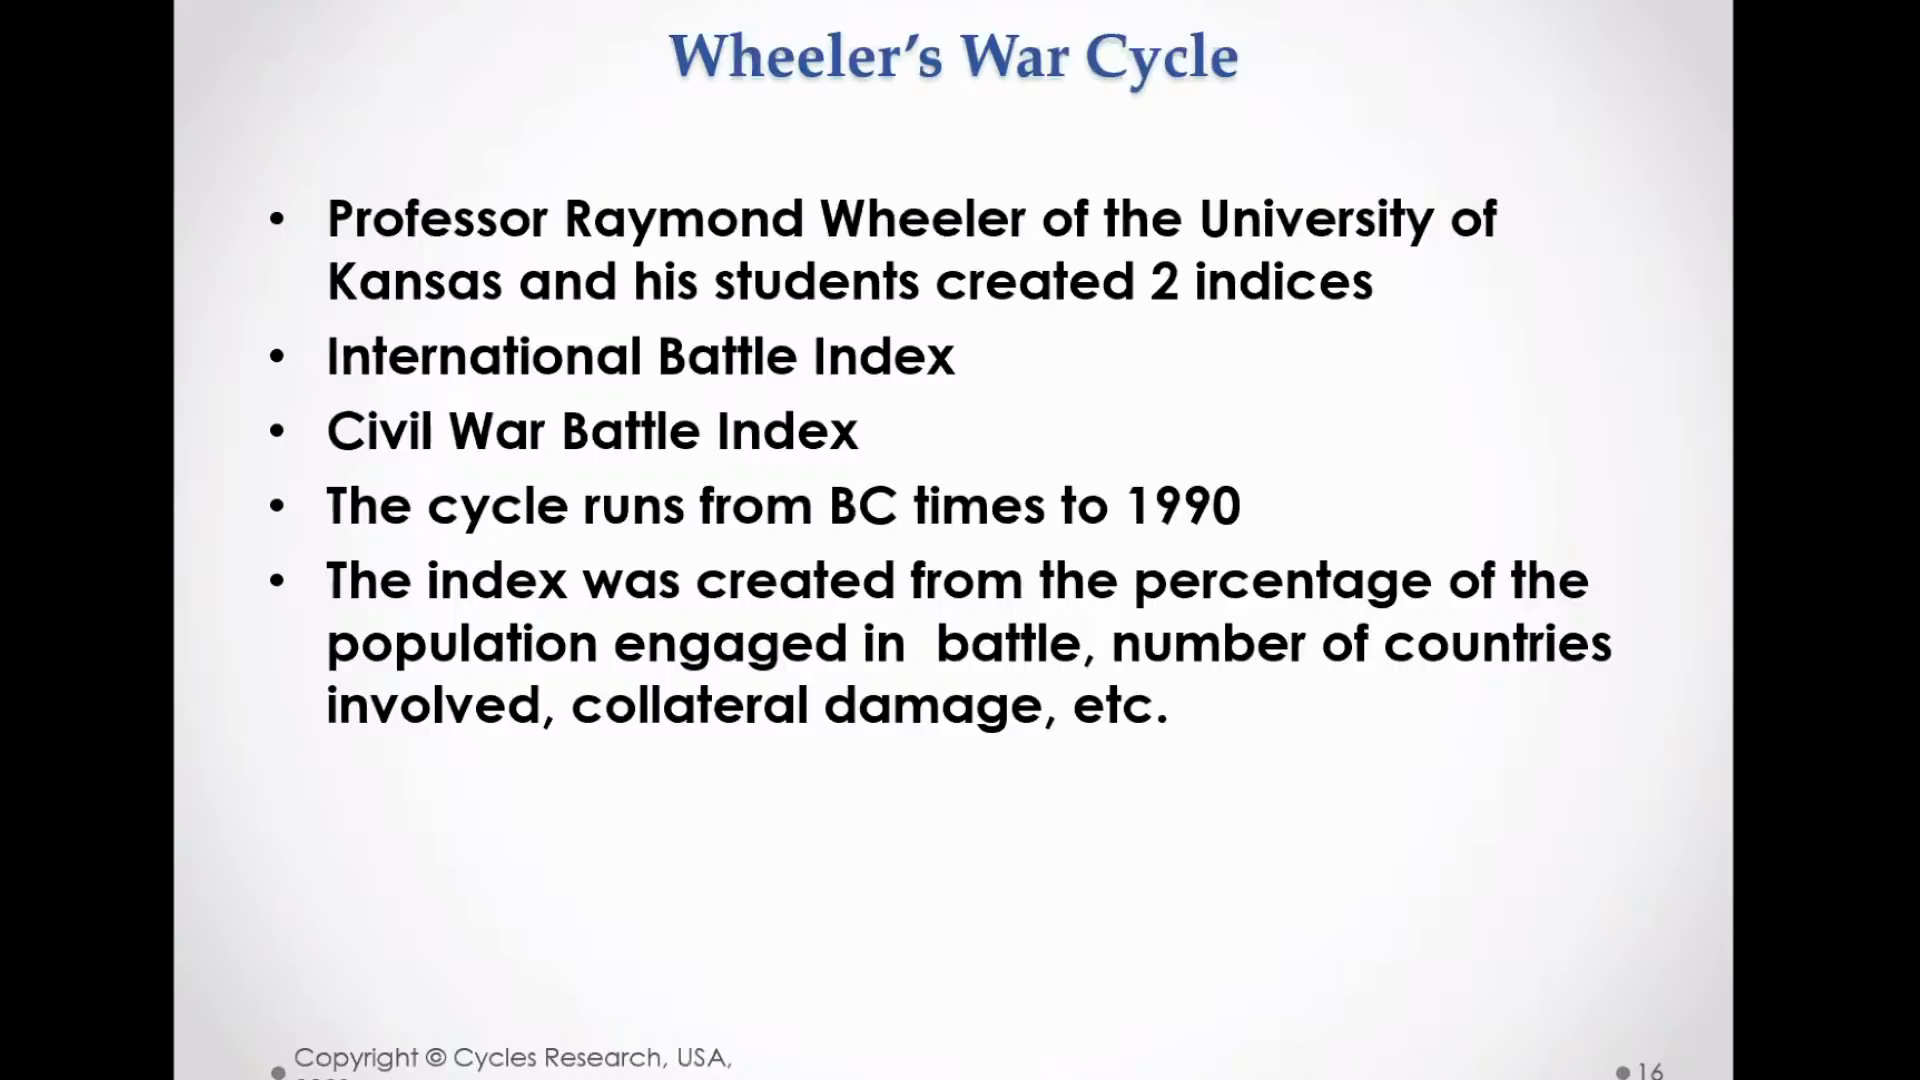 Professor Raymond Wheeler — background on the War Cycle framework and its originator.
Source: PSE Video
Professor Raymond Wheeler — background on the War Cycle framework and its originator.
Source: PSE Video