Summary
The liquidity cycle tracks the global flow of credit, money supply, and bank reserves as the fuel driving the real estate and broader asset cycle. Akhil Patel at PSE draws on Michael Howell’s Global Liquidity Index research to argue: when liquidity rises, all risk assets (Bitcoin, equities, real estate) rise in tandem; when liquidity contracts, they fall. The October 2022 low was identified as the global liquidity trough and confirmed the mid-cycle bottom. Bitcoin is treated as the most sensitive liquidity proxy (it leads other assets by 3–6 months). Liquidity “flatlining” or declining signals the late-cycle warning. The connection between credit and asset cycles has been documented across multiple intellectual traditions: Hyman Minsky’s Financial Instability Hypothesis, Ryan-Collins et al.’s land-credit feedback loop, and Howell’s empirical global liquidity work.
Core Claims
- 2026-02-16-bitcoin-crash-end-of-cycle (2026-02-16): “The collapse in bitcoin is a warning sign. It signals liquidity slowdown at a time when we are expecting a peak in the cycle.” — Akhil Patel — confidence: high
- 2024-09-26-bbi-september-2024 (2024-09-26): Global liquidity cycle bottom = October 2022; coincides with mid-cycle low; second-half acceleration now underway. — confidence: high
- 2024-09-26-bbi-september-2024 (2024-09-26): US bank reserves chart shows flat trend as of late 2025 — liquidity flatlining. — confidence: high
- 2026-02-16-bitcoin-crash-end-of-cycle (2026-02-16): Bitcoin tracks liquidity flows; its crash signals liquidity tightening. — confidence: high
- 2021-03-03-sub-email-6-2021-roadmap-march-update (2021-03-03): US M2 rate of change rising steadily after going negative post mid-cycle slowdown — signals improving liquidity. — confidence: high
- 2026-03-23-private-credit-crumble (2026-03-23): “The real estate cycle always finds a way to complete itself. The construction and economic boom need fuel in the form of credit and liquidity to do so.” — confidence: high
- 2022-08-17-bbi-august-2022 (2022-08-17): Current sell-off is a liquidity-driven panic (forced selling of quality assets), not a cycle-ending crash. — Akhil Patel — confidence: high
- 2026-05-13-gann-sub-email-gann-10-for-2026-market-update-13-may (2026-05-13): “Relative weakness across the crypto space could hold an important message for the broader market outlook too. I’ll have more next week on what cryptocurrencies like Bitcoin can tell us at this point in the cycle, where asset classes most sensitive to developments with liquidity and monetary policy should be watched carefully.” — Phil Anderson — confidence: high
Mechanism / How It Works
What Is Liquidity?
In PSE’s usage, “liquidity” encompasses:
- Global M2 money supply — total money in the system
- US bank reserves — Fed balance sheet driven; expands with QE, contracts with QT
- Private credit creation — shadow banking; most important for cycle
- Global central bank assets — combined Fed, ECB, PBoC, BoJ balance sheets
Liquidity as Cycle Fuel
- Recovery begins after cycle low: credit conditions easy, banks resume lending
- Money supply expands → all assets (real estate, equities, commodities, Bitcoin) rise
- Mid-cycle slowdown: brief liquidity contraction (2020 COVID, 2022 rate hikes)
- Second half: government stimulus, rate cuts → new liquidity surge → “mania phase”
- End-of-cycle: credit exhaustion; private credit collapses; global liquidity flattens → falls
- Cascade: forced selling → prices fall → more margin calls → credit destruction
Ryan-Collins et al. (2017) provide the structural underpinning: mortgage credit liberalization enables the land-credit feedback loop that amplifies each cycle’s liquidity expansion. Minsky’s Financial Instability Hypothesis describes how stability breeds instability — each recovery encourages more speculative finance [Source: Ryan-Collins, 2017].
Bitcoin as Liquidity Proxy
Akhil Patel established Bitcoin as the most sensitive real-time gauge of global liquidity, drawing on Michael Howell’s work:
- Rising liquidity: Bitcoin leads equities up by 3–6 months
- Declining liquidity: Bitcoin leads equities down
- Bitcoin’s 50% crash from 60k (early 2026) = leading indicator of broader liquidity tightening
- “The collapse in Bitcoin is a warning sign” — this was the cycle-top warning before the property/equity peak
PSE Liquidity Indicators
- Commercial bank credit growth (FRED): PSE tracks this in quarterly chartbook
- US M2 money supply growth rate
- US Federal Reserve bank reserves (flat = end of QE; declining = QT)
- Corporate bond spreads (widening = liquidity stress)
- Private credit redemptions (Blue Owl, Blackstone BCRED events in 2026)
Historical Liquidity Events
| Event | Date | Liquidity Effect | PSE Interpretation |
|---|---|---|---|
| COVID QE | March 2020 → 2022 | Massive expansion | Turbocharged second half |
| Rate hikes begin | March 2022 | Contraction begins | Mid-cycle slowdown |
| Global liquidity bottom | October 2022 | Trough | Mid-cycle low confirmed |
| Fed pivot (rate cuts) | Sept 2024 | Re-expansion | Late-cycle surge begins |
| Bitcoin peak | October 2025 | Liquidity leading indicator peak | Warning signal |
| Private credit crisis | Feb–Mar 2026 | Credit contraction begins | Cycle-end confirmed |
| Bitcoin -50% | Feb 2026 | Liquidity tightening | ”Warning sign” per Akhil |
The Great Maturity Wall
Identified by Akhil Patel as a structural liquidity crisis trigger:
- ~$350 trillion in global corporate debt requiring refinancing
- If yields stay elevated, this debt cannot refinance at acceptable rates → forced deleveraging
- Combined with private credit collapse = liquidity vacuum at cycle end
Applications
- Monitor Bitcoin: As a real-time global liquidity gauge; lead indicator for markets
- Watch M2 growth rate: Turning negative signals contraction (happened briefly in 2022 for first time)
- Track bank reserves: Fed balance sheet tells you if QE is adding or QT is removing
- Corporate spreads: IG and HY spreads widening = early warning
- Private credit: Any gate/redemption blocking = Lehman-style signal for shadow banking
- PSE Indicators Chartbook: PSE publishes quarterly; track “Positive indicators” vs. “Warning indicators”
Q2 2025 PSE Indicators Snapshot (per chartbook)
Positive: Economic Bliss rising, commercial bank credit growing, M2 growing, S&P/Case-Shiller house prices rising, yield curve normalizing Warning: Corporate bond spread widening, US homebuilder ETF trending lower, NAHB homebuilder sentiment falling Conclusion: Liquidity improving but housing warning signs active
Contradictions & Open Questions
- Bitcoin’s crash in late 2025/early 2026 could indicate liquidity peaked before the property cycle top — creating a timing discrepancy in PSE’s framework
- Government stimulus can artificially extend liquidity beyond natural cycle — as it did in 2020; could it again?
- Is global liquidity actually flatlining or is the US data misleading (other central banks still expanding)?
- The “Great Maturity Wall” has been flagged for 2–3 years — if it doesn’t trigger a crisis, what does that imply?
- Michael Howell’s Global Liquidity Index methodology is external to PSE — how closely does PSE track vs. Howell’s framework?
Related Concepts
- bitcoin-cycle
- private-credit
- 18-6-year-real-estate-cycle
- bond-yields
- sector-rotation
- winners-curse-phase
- Land-Credit Feedback Loop — structural mechanism behind the credit side of liquidity
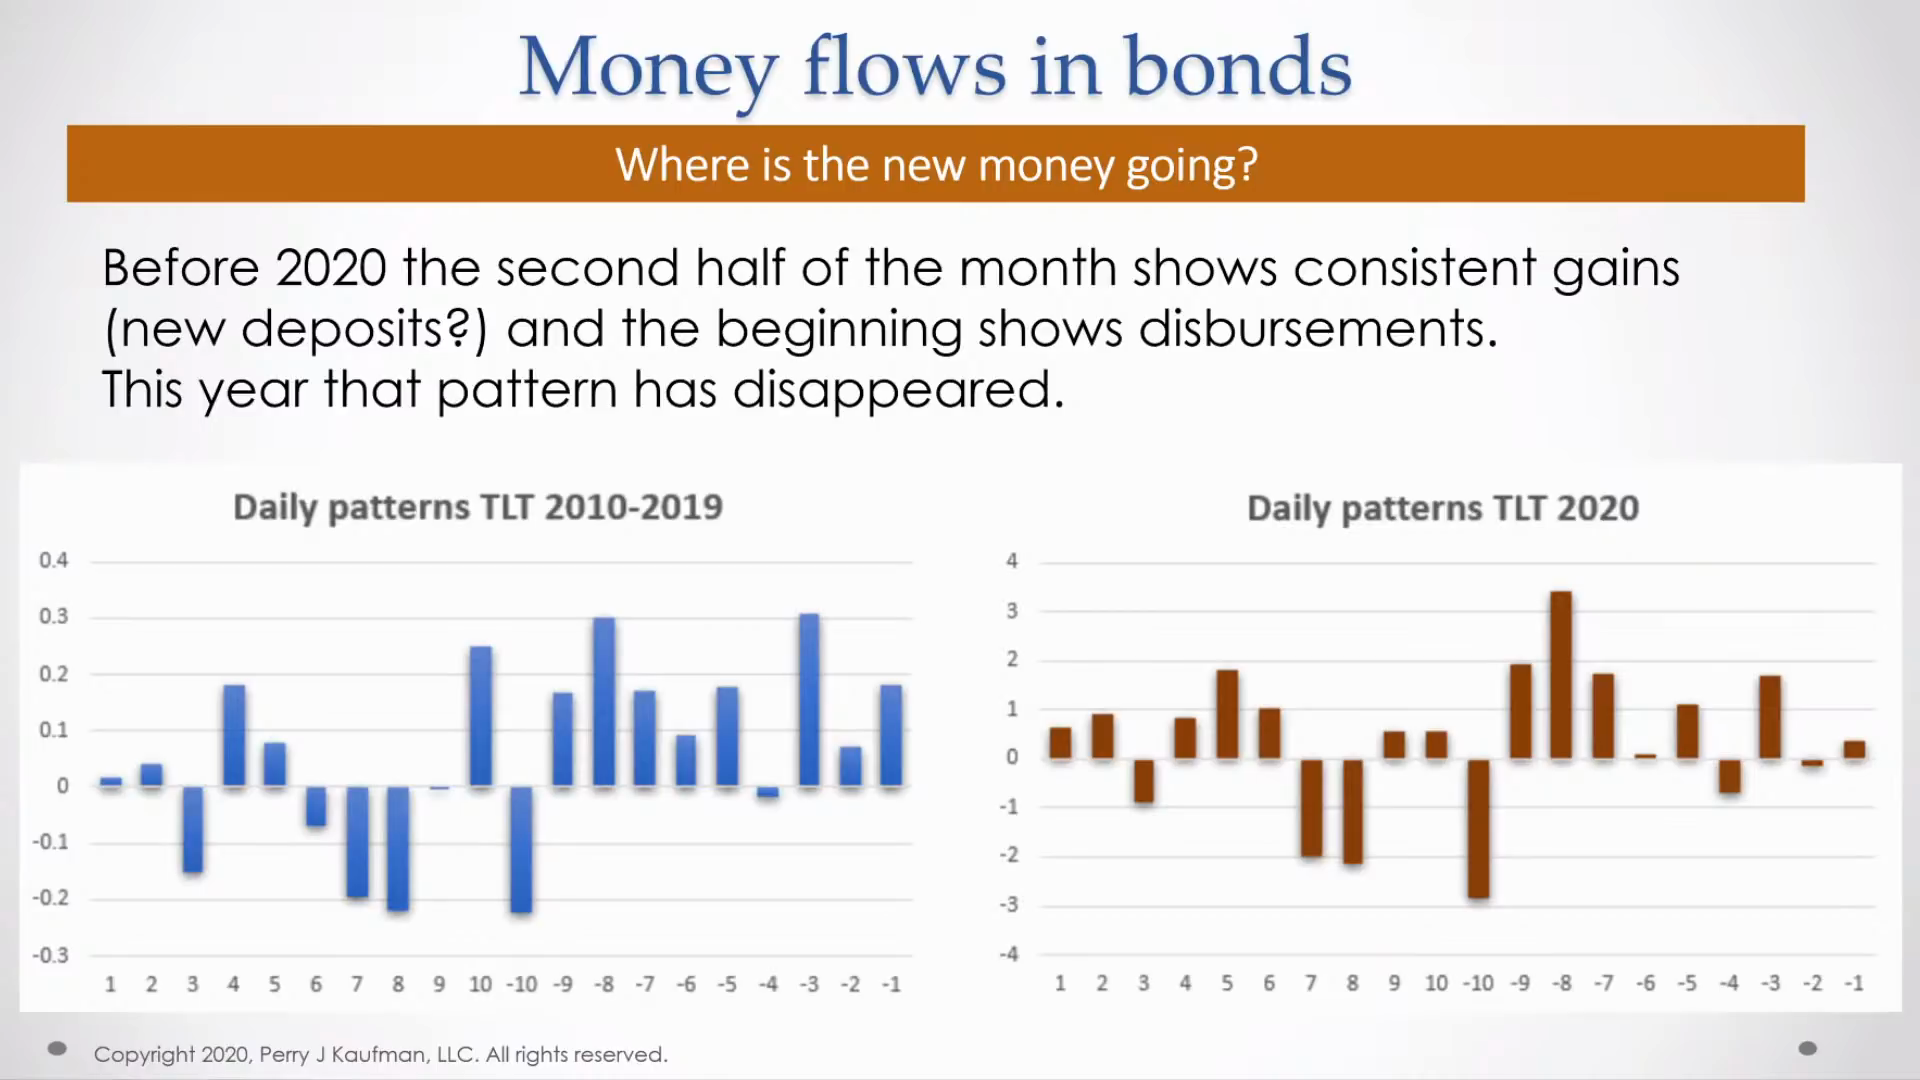 Money flows in bonds — tracking liquidity movement from equities into bonds near cycle end.
Source: PSE Video
Money flows in bonds — tracking liquidity movement from equities into bonds near cycle end.
Source: PSE Video
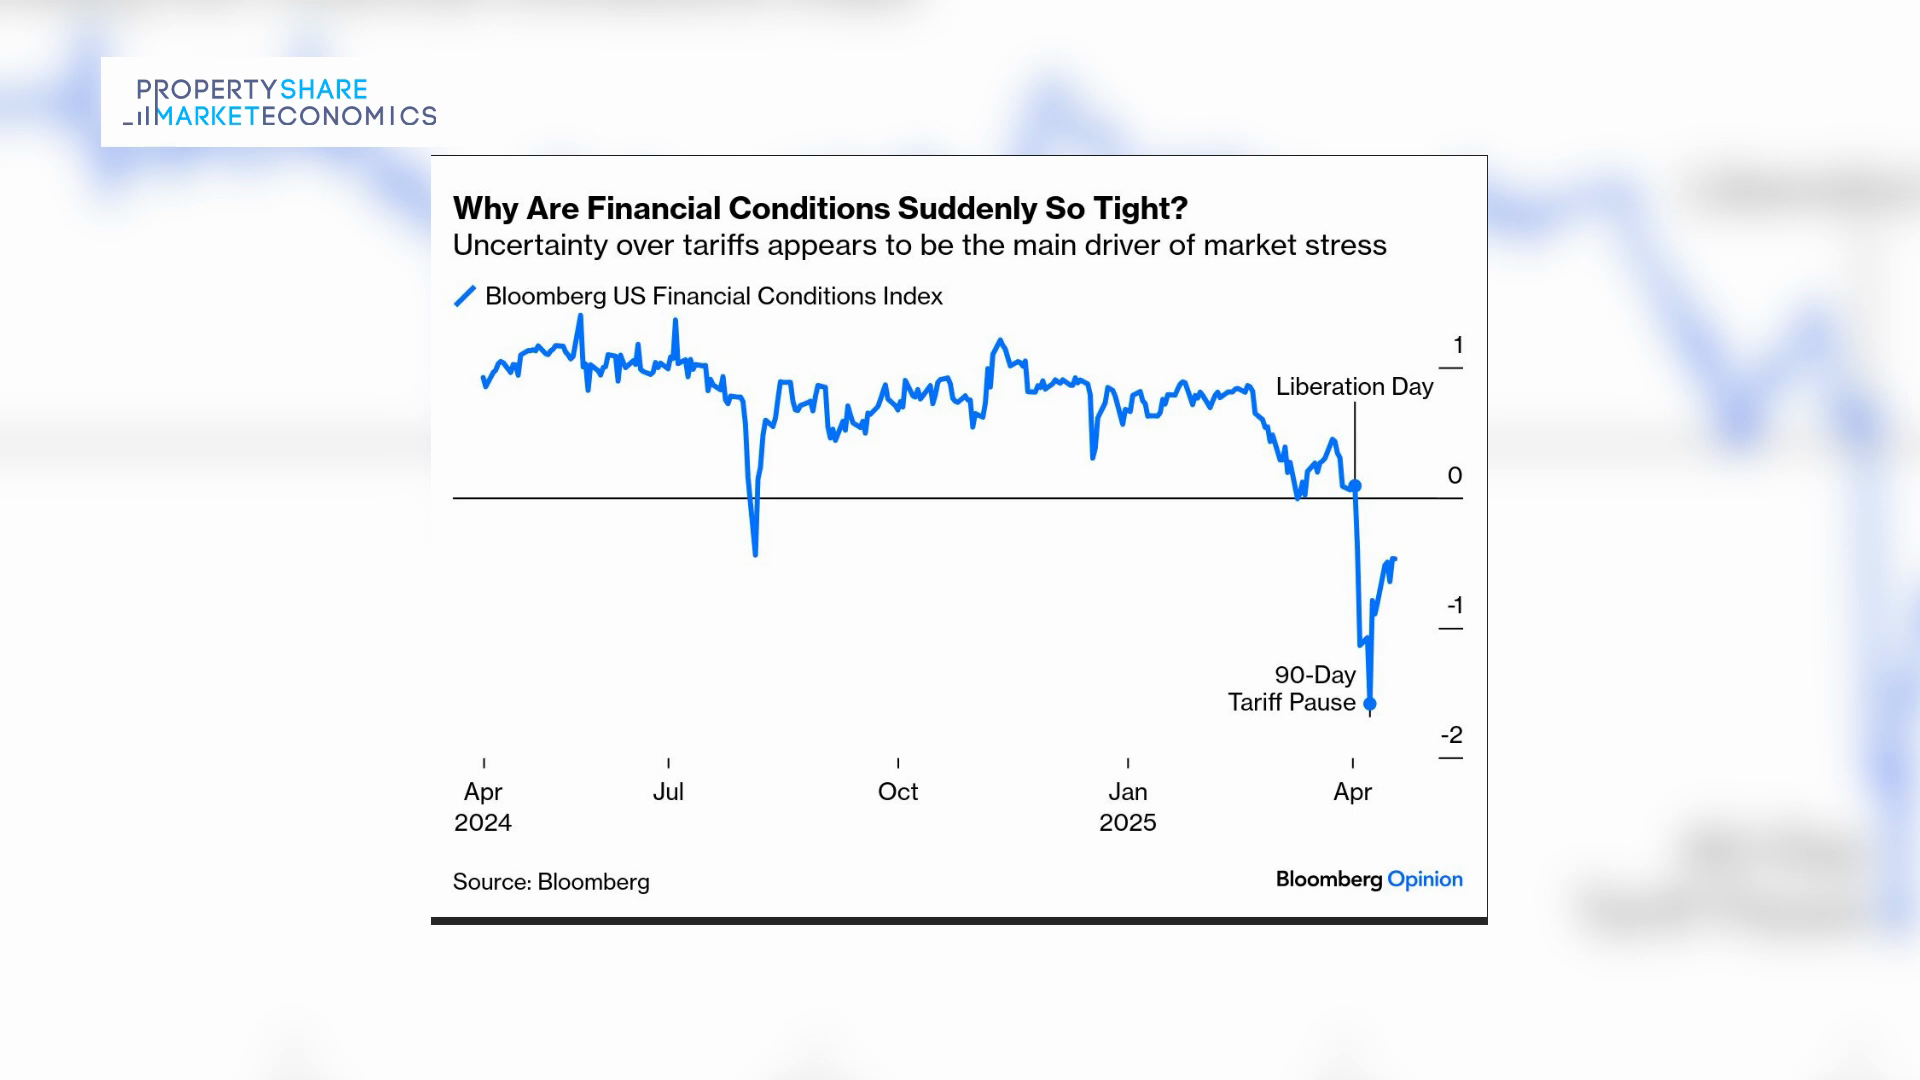
 Financial conditions index — credit tightness as a liquidity cycle indicator.
Source: PSE Video
Financial conditions index — credit tightness as a liquidity cycle indicator.
Source: PSE Video
More Charts
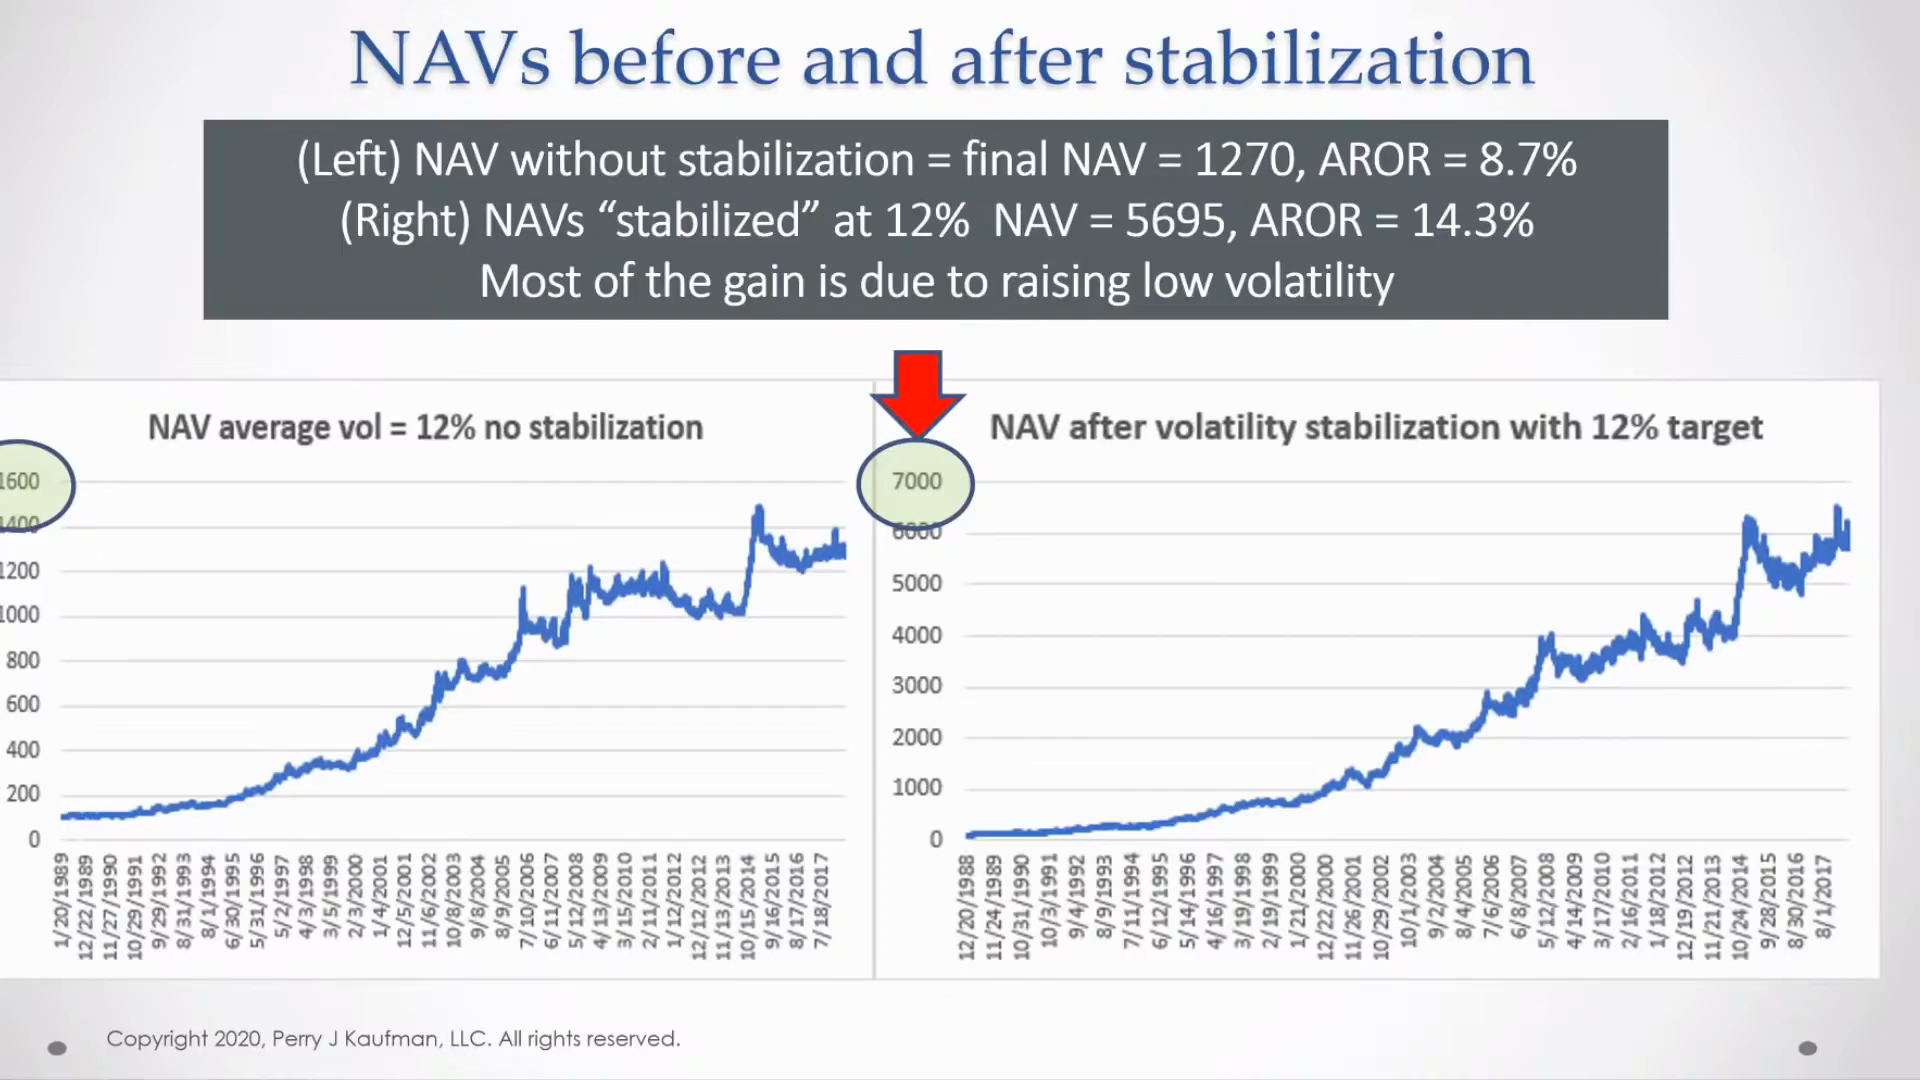 NAV comparison chart — showing fund flows and liquidity impact on asset prices.
Source: PSE Video
NAV comparison chart — showing fund flows and liquidity impact on asset prices.
Source: PSE Video
 Financial conditions tightening — graph showing liquidity tightening at cycle end.
Source: PSE Video
Financial conditions tightening — graph showing liquidity tightening at cycle end.
Source: PSE Video
 Interest rates and markets — how rising rates constrain liquidity and land values.
Source: PSE Video
Interest rates and markets — how rising rates constrain liquidity and land values.
Source: PSE Video
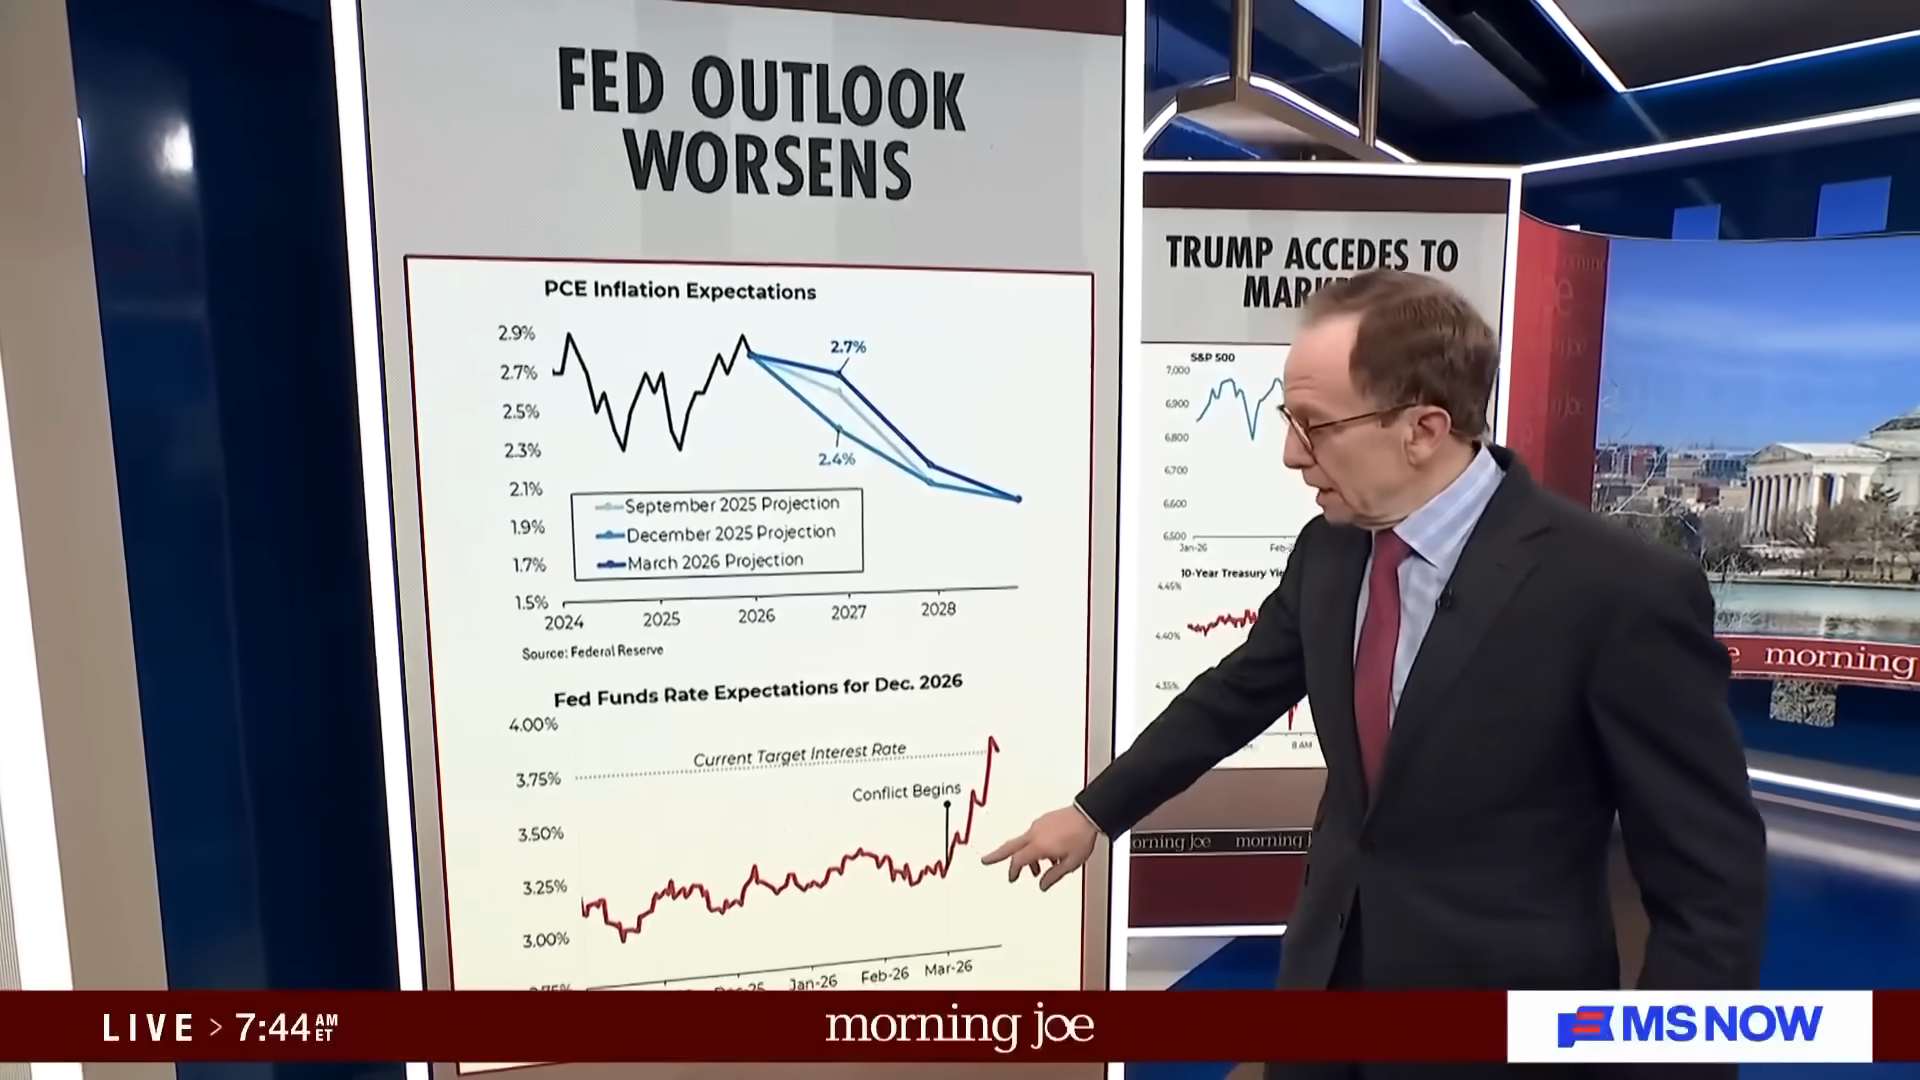 PCE inflation and Fed Funds rate — key liquidity indicators at the current cycle stage.
Source: PSE Video
PCE inflation and Fed Funds rate — key liquidity indicators at the current cycle stage.
Source: PSE Video