Summary
In the late stage of the 18.6-year cycle, investment capital rotates from technology/growth stocks into industrial, resource, banking, and infrastructure stocks (“HALO” — Heavy Asset Low Obsolescence). This rotation pattern has been visible since late 2025/early 2026: Nasdaq peaked October 2025 (with Bitcoin), while UK FTSE, Nikkei, Germany, Australia indices broke out to new highs. Dow Jones peaked February 10, 2026. The rotation is consistent with the pattern seen in prior cycles.
Core Claims
- 2026-03-02-roadmap-cycle-update-february (2026-03-02): Capital rotating from US tech into European/Asian/industrial/resource/banking stocks (FTSE, Nikkei, Germany, Australia). — confidence: high
- 2026-05-13-gann-sub-email-gann-10-for-2026-market-update-13-may (2026-05-13): iShares US Home Construction ETF (ITB) made its high October 2024 — echoing the 2005 homebuilder top that preceded the 2007 S&P peak by two years. Home goods retailers (Ethan Allen/ETD, RH, Home Depot/HD) are breaking to multi-year lows with S&P near record highs. — Phil Anderson — confidence: high
- 2026-05-13-gann-sub-email-gann-10-for-2026-market-update-13-may (2026-05-13): XLF (Financial Select Sector SPDR) has not returned to January 2026 highs and is struggling to break above the 200-day moving average — financials joining homebuilders as a lagging cyclical sector. — Phil Anderson — confidence: high
- 2026-05-13-gann-sub-email-gann-10-for-2026-market-update-13-may (2026-05-13): Commodity sectors (DBA agriculture) continue to show relative strength — consistent with late-cycle commodity rotation. — Phil Anderson — confidence: high
- 2026-03-02-roadmap-cycle-update-february (2026-03-02): Nasdaq peaked Oct 2025; Dow peaked Feb 10, 2026. — confidence: high (confirmed)
- 2026-03-02-roadmap-cycle-update-february (2026-03-02): HALO stocks = “Heavy Asset Low Obsolescence” — manufacturers, utilities, defence, resource companies. — confidence: high
- 2026-03-02-roadmap-cycle-update-february (2026-03-02): “Era of US stock market exceptionalism is now over.” — confidence: high
- 2026-03-02-roadmap-cycle-update-february (2026-03-02): Dow Jones Transportation Average strong — historically tops AFTER the Industrial Average (May 2008 vs Oct 2007). — confidence: high
- 2026-03-02-roadmap-cycle-update-february (2026-03-02): Equal-weighted S&P500 outperforming cap-weighted since late 2025 = broad participation. — confidence: high
Mechanism / How It Works
- Early cycle: tech/growth stocks lead (high risk appetite, low rates)
- Mid-cycle: tech continues to lead but narrative shifts (cash piles → AI investment → debt)
- Late cycle: tech narrative collapses (AI cost pressure on SaaS, capital exhausted)
- Capital rotates to HALO: large physical assets, long lead times, permitting moats
- Industrial countries (UK, Germany, Japan, Australia) outperform US tech-heavy indices
- Dow Transports top last — when transports break, the broader cycle is ending
Applications
- UK FTSE, Nikkei, DAX, ASX breaking out = late-cycle rotation signal (confirmed early 2026)
- HALO sector: buy industrials, utilities, defence, materials/resources
- ASX listed large bank ETF (BNKS): up 140% from Oct 2022 lows as of Feb 2026
- Watch Dow Transports for the late-cycle warning
Contradictions & Open Questions
- Rotation from US tech started — but US markets still large; full rotation could take months
- HALO outperformance: when does it end (with the overall cycle)?
- As of May 2026, five mega-cap AI stocks account for half of S&P gains since April — yet AI tech is supposed to be a sector that lags late-cycle. Does AI exceptionalism complicate the standard rotation thesis?
Related Concepts
Visual Evidence
Slides illustrating sector rotation, market phase transitions, and comparative performance.
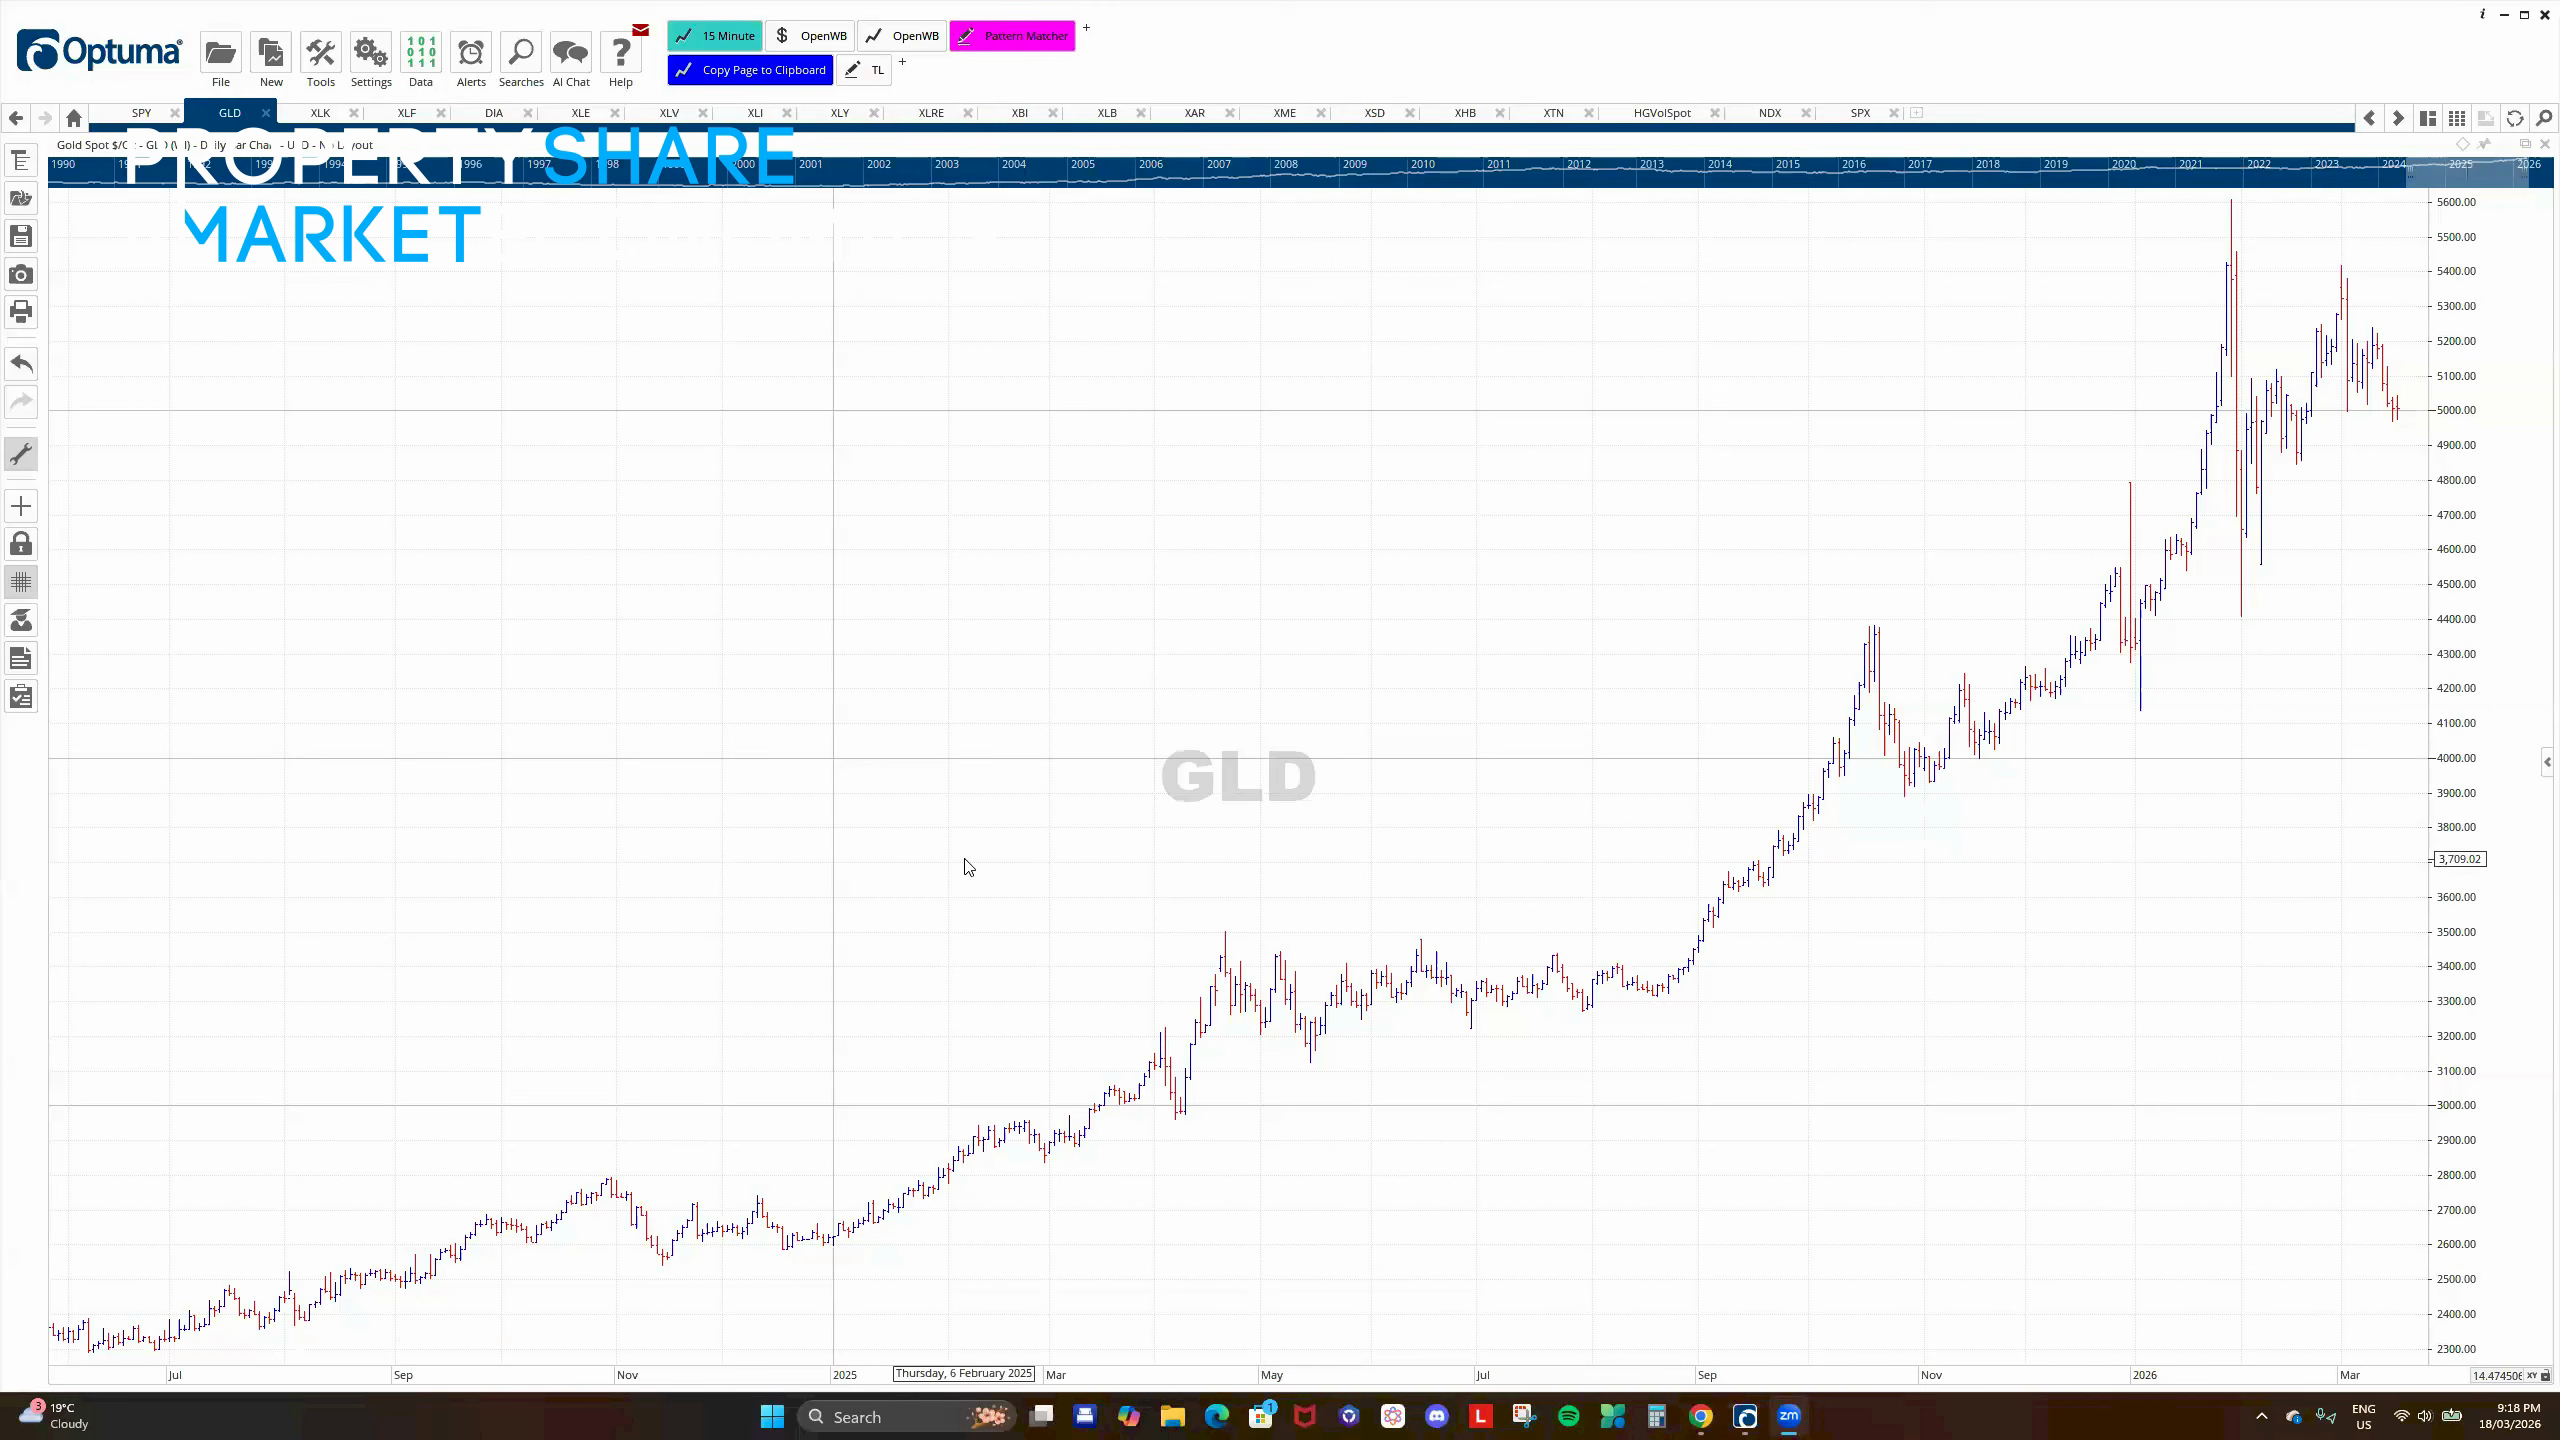 Stock market data with sector indicators — market phase tracking chart.
Source: PSE Video
Stock market data with sector indicators — market phase tracking chart.
Source: PSE Video
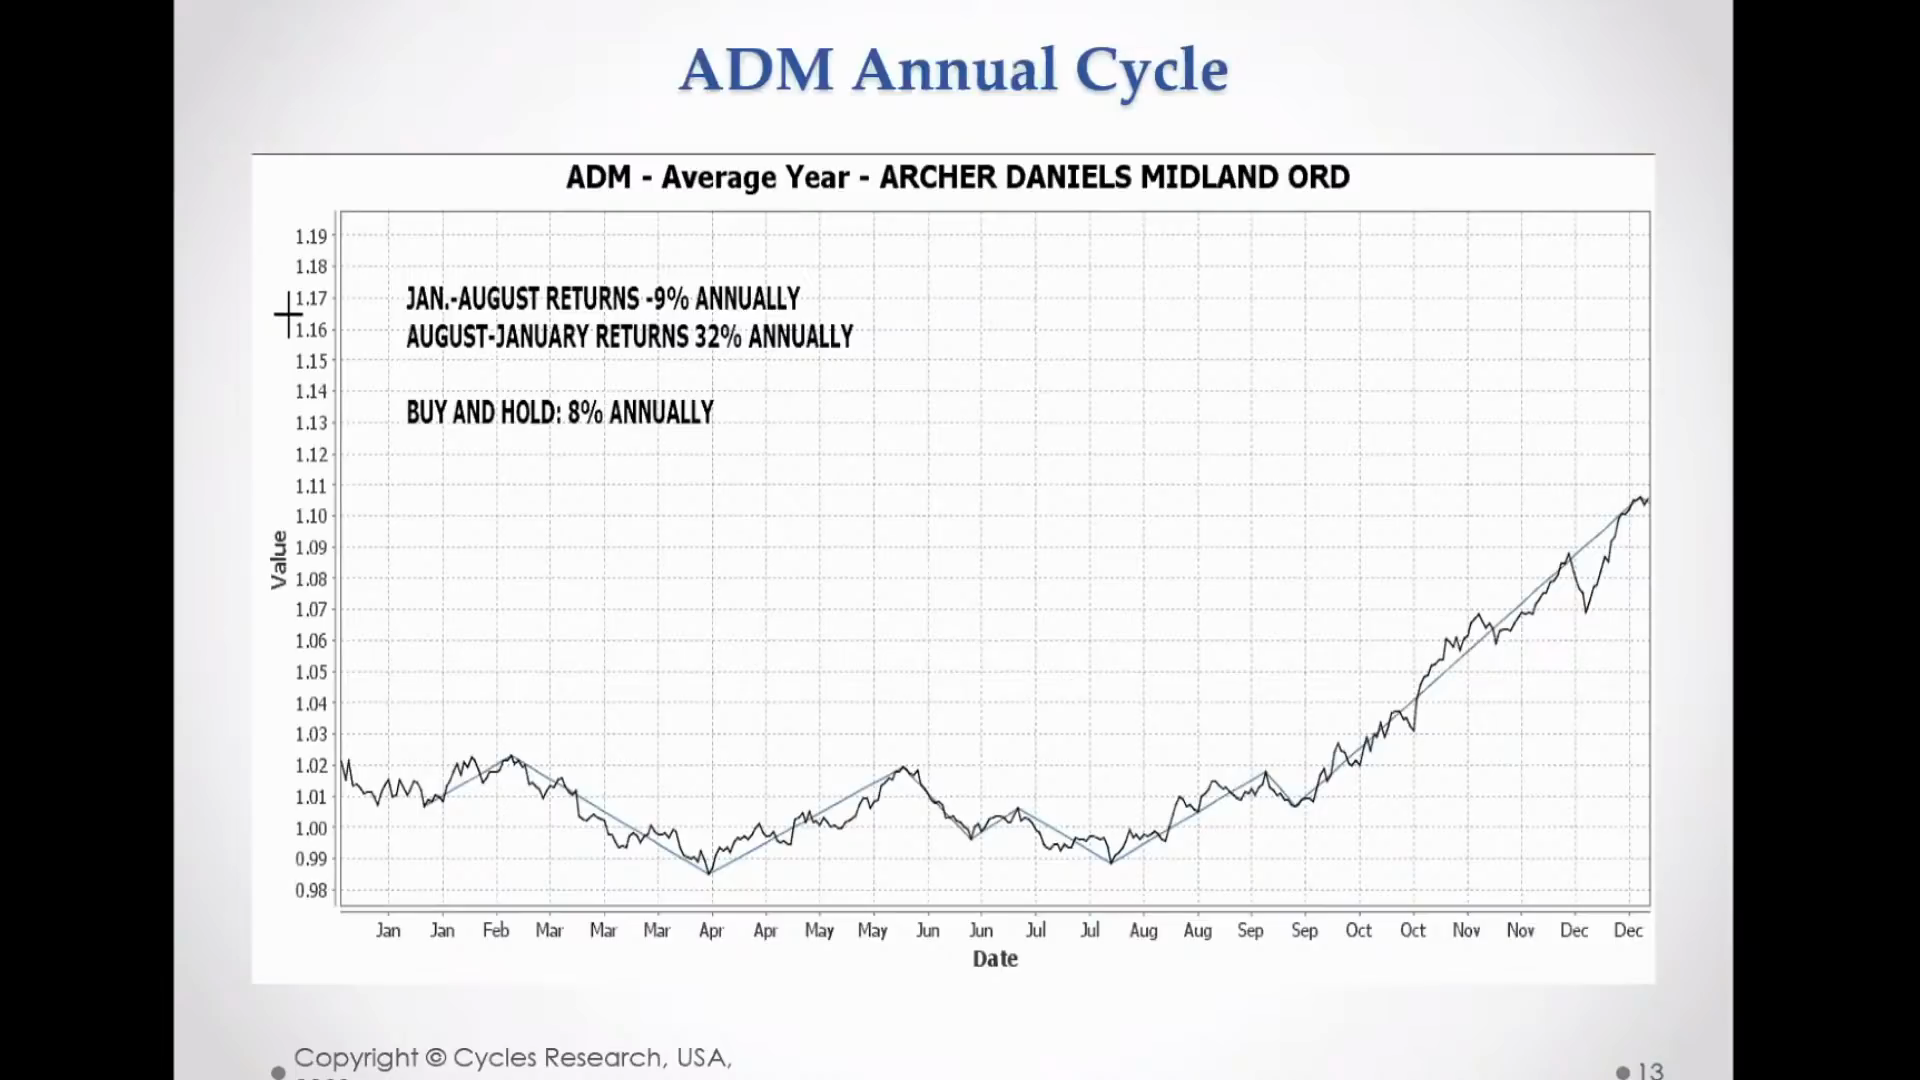 ADM annual cycle with returns — annual seasonal cycle patterns by sector.
Source: PSE Video
ADM annual cycle with returns — annual seasonal cycle patterns by sector.
Source: PSE Video
 Stock performance comparison — time series chart comparing sector returns.
Source: PSE Video
Stock performance comparison — time series chart comparing sector returns.
Source: PSE Video
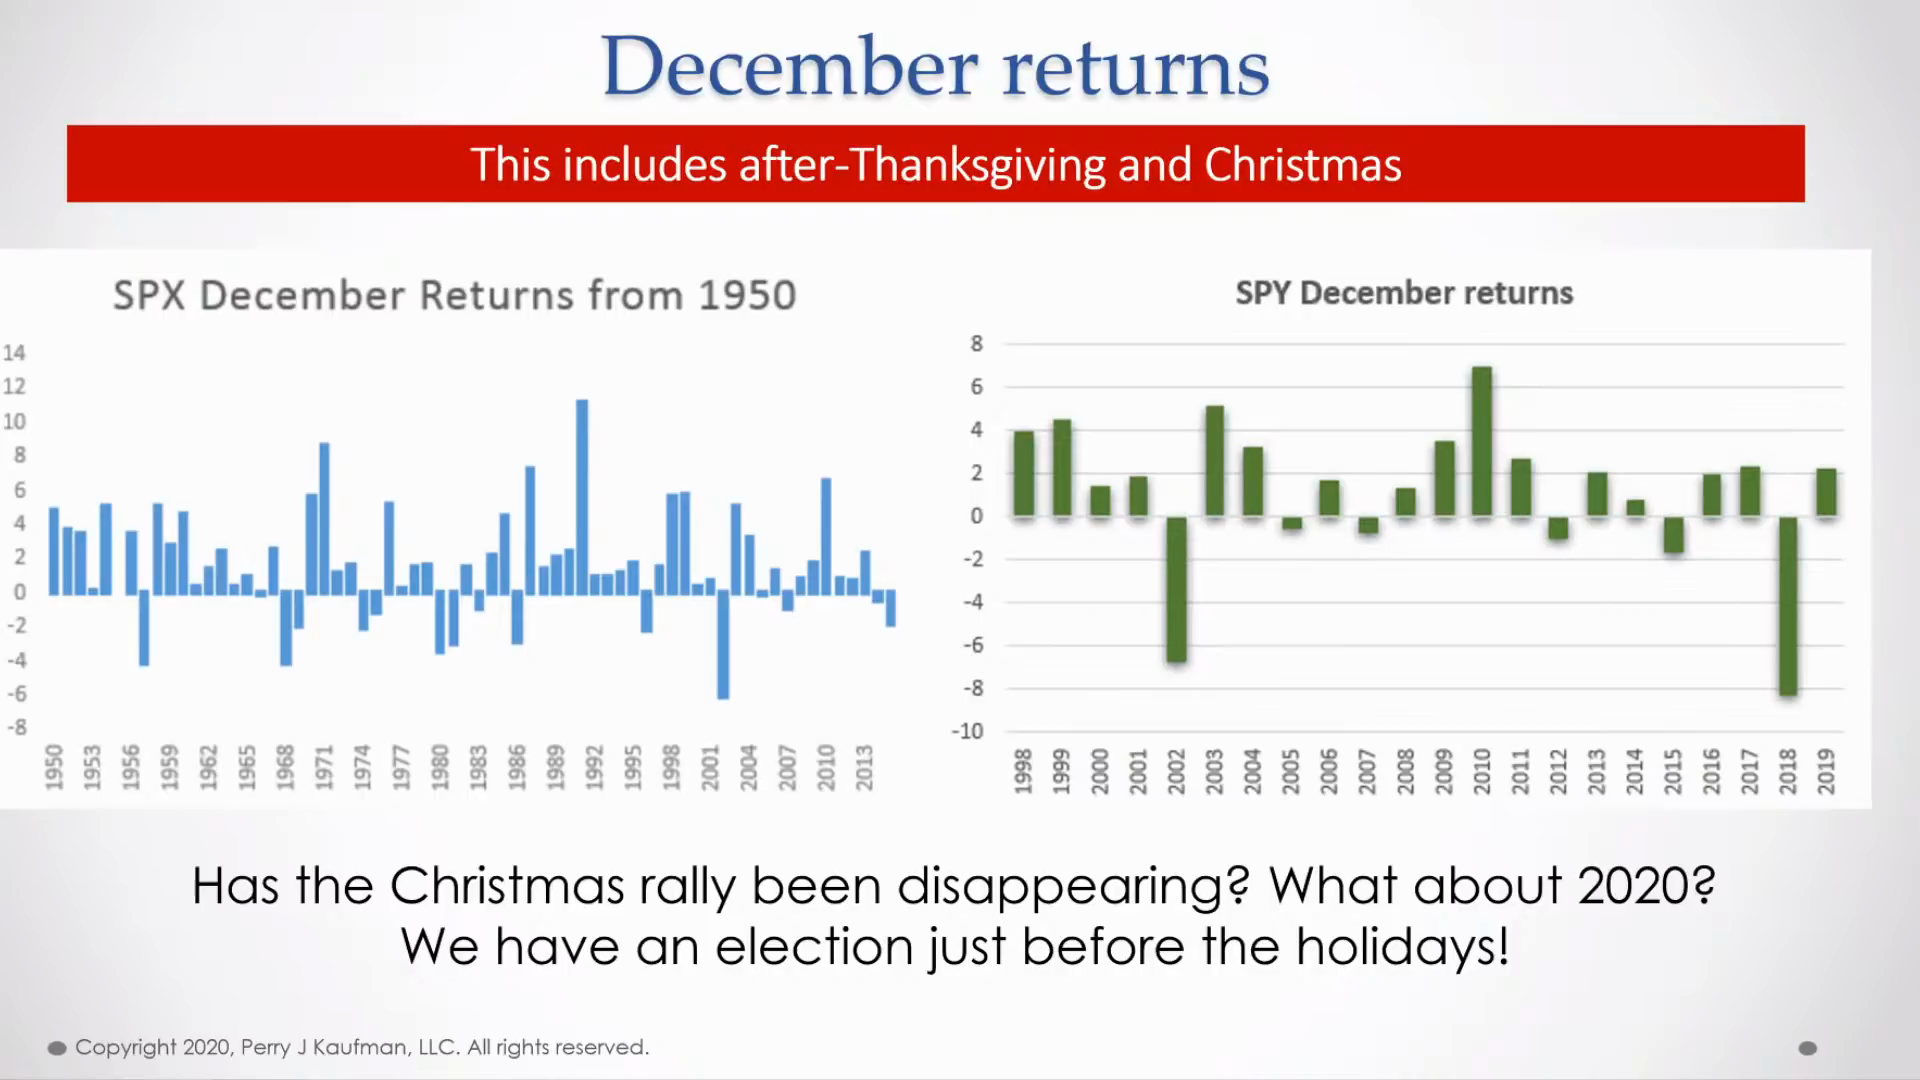 December SPX/SPY returns — year-end seasonal pattern for equity rotation.
Source: PSE Video
December SPX/SPY returns — year-end seasonal pattern for equity rotation.
Source: PSE Video
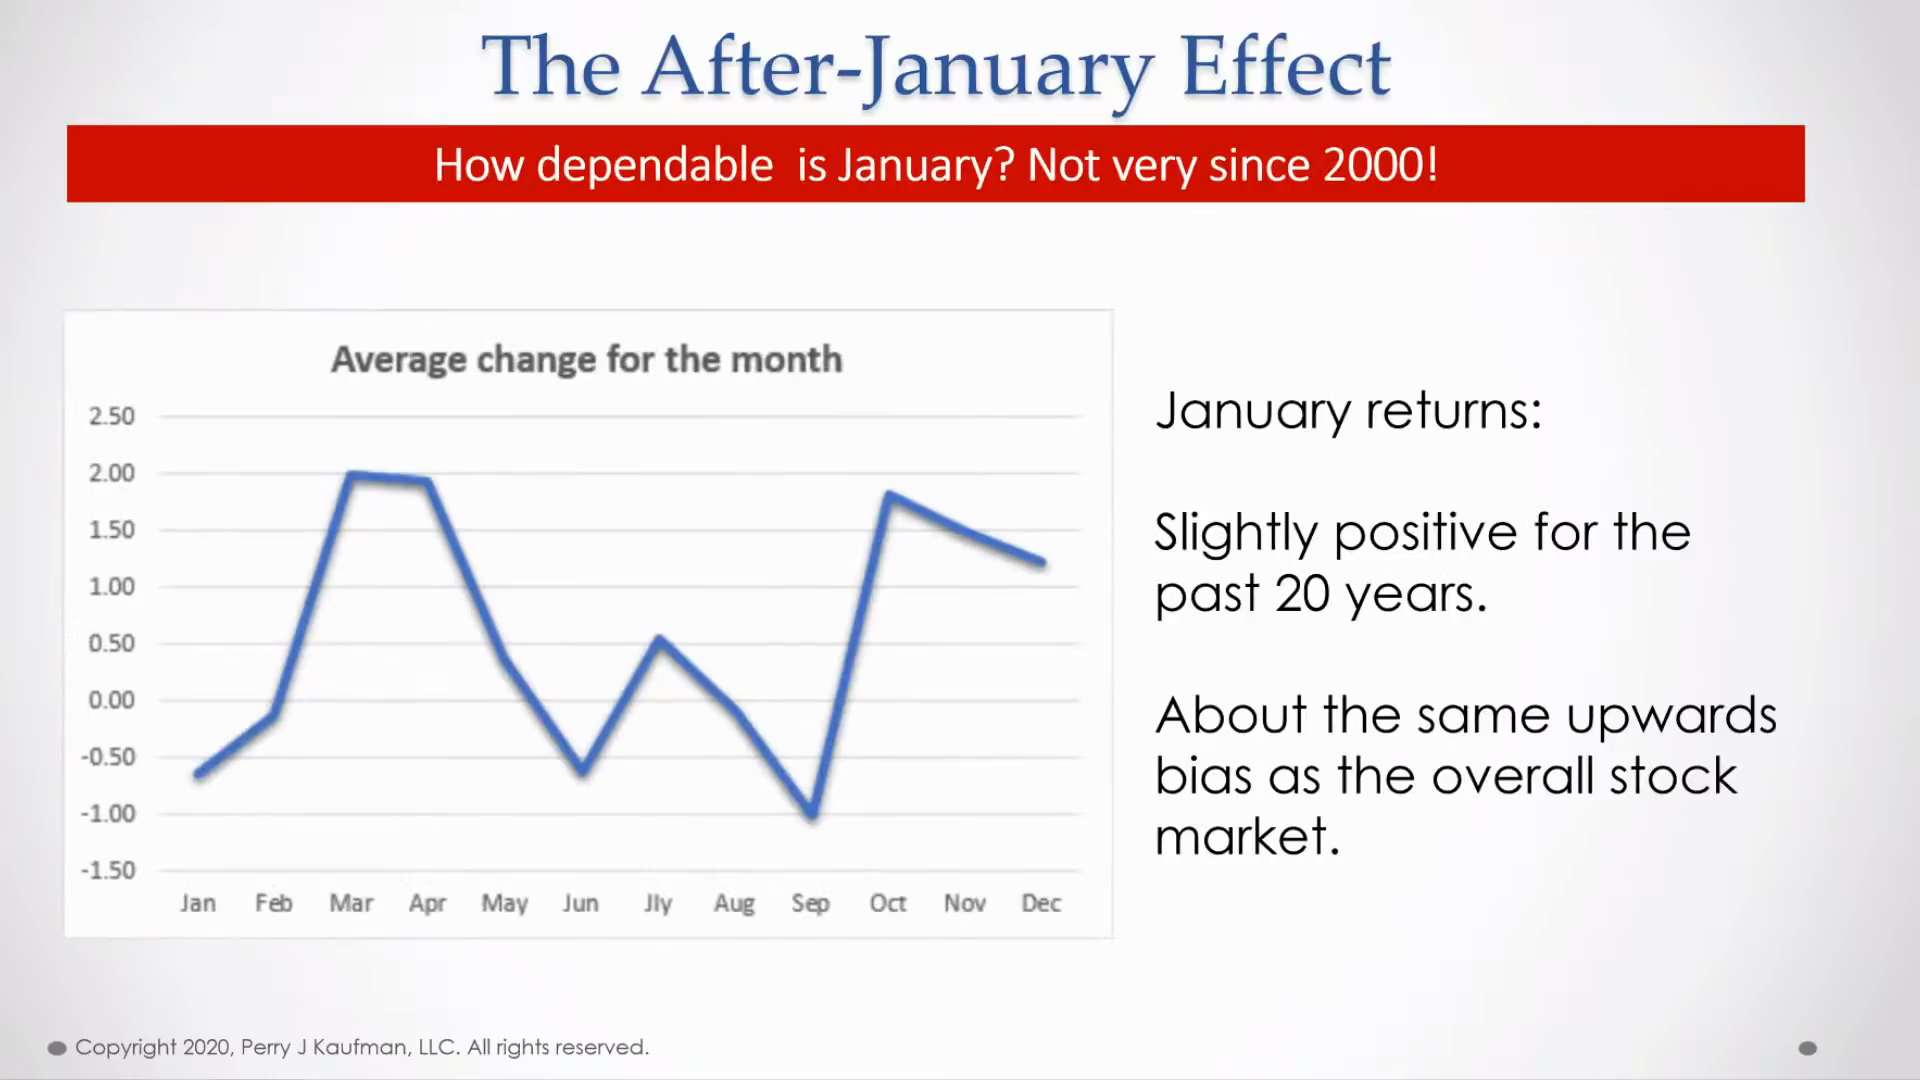 The After-January Effect — seasonal market pattern relevant to sector rotation timing.
Source: PSE Video
The After-January Effect — seasonal market pattern relevant to sector rotation timing.
Source: PSE Video
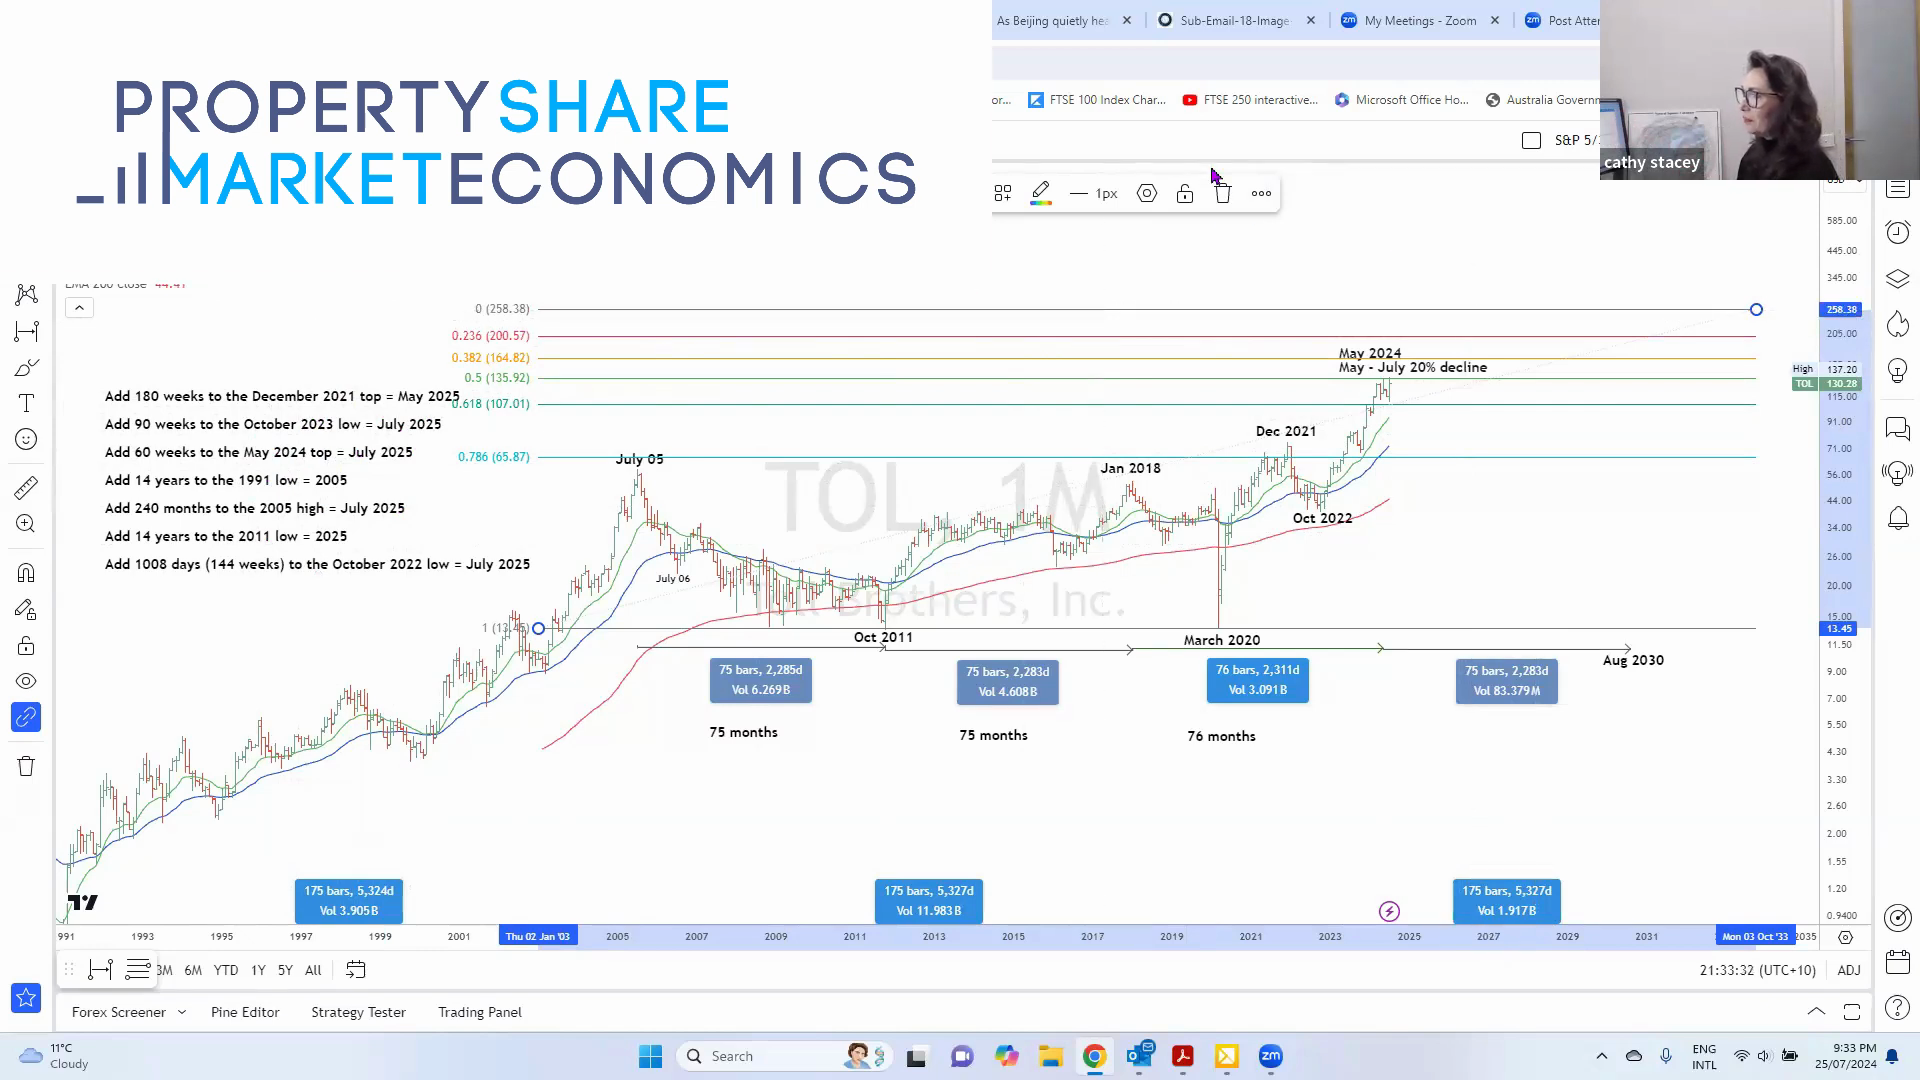
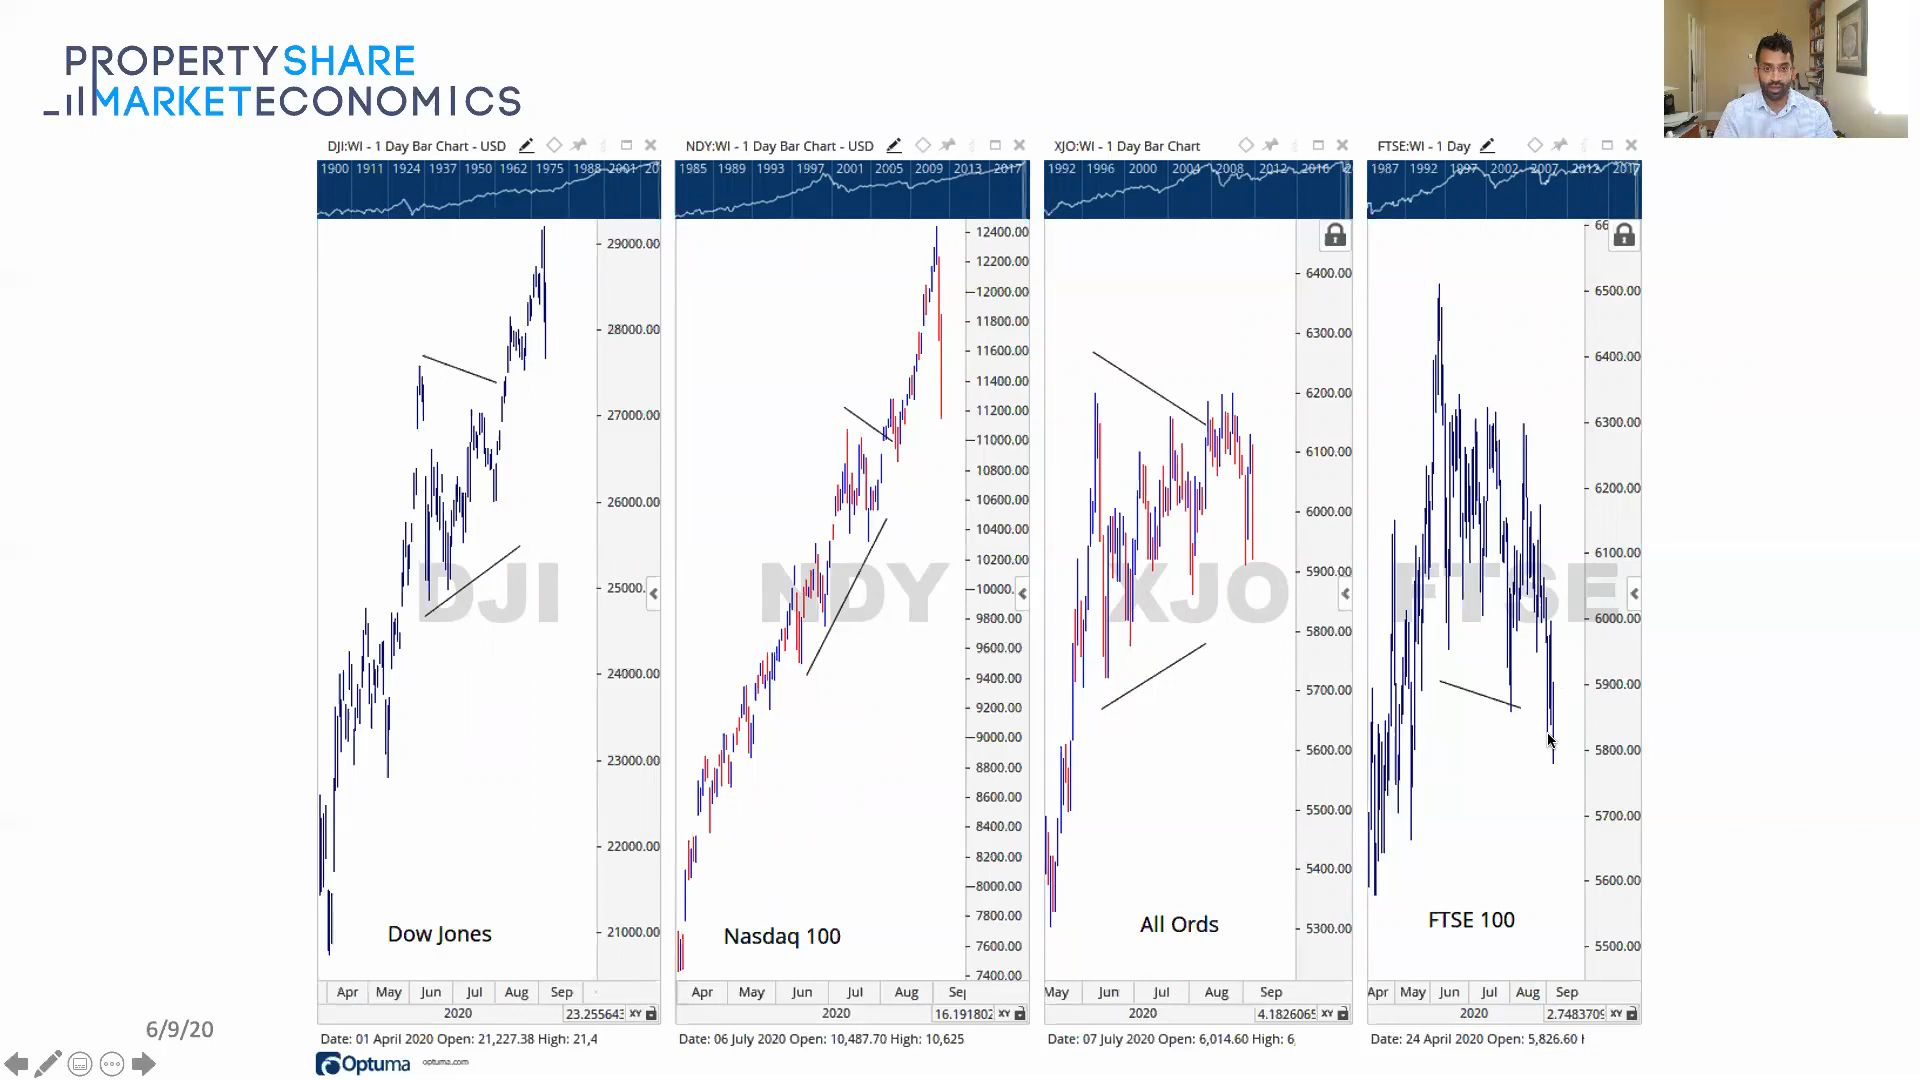 Dow Jones / Nasdaq / All Ords — comparative performance of major indices across cycle.
Source: PSE Video
Dow Jones / Nasdaq / All Ords — comparative performance of major indices across cycle.
Source: PSE Video
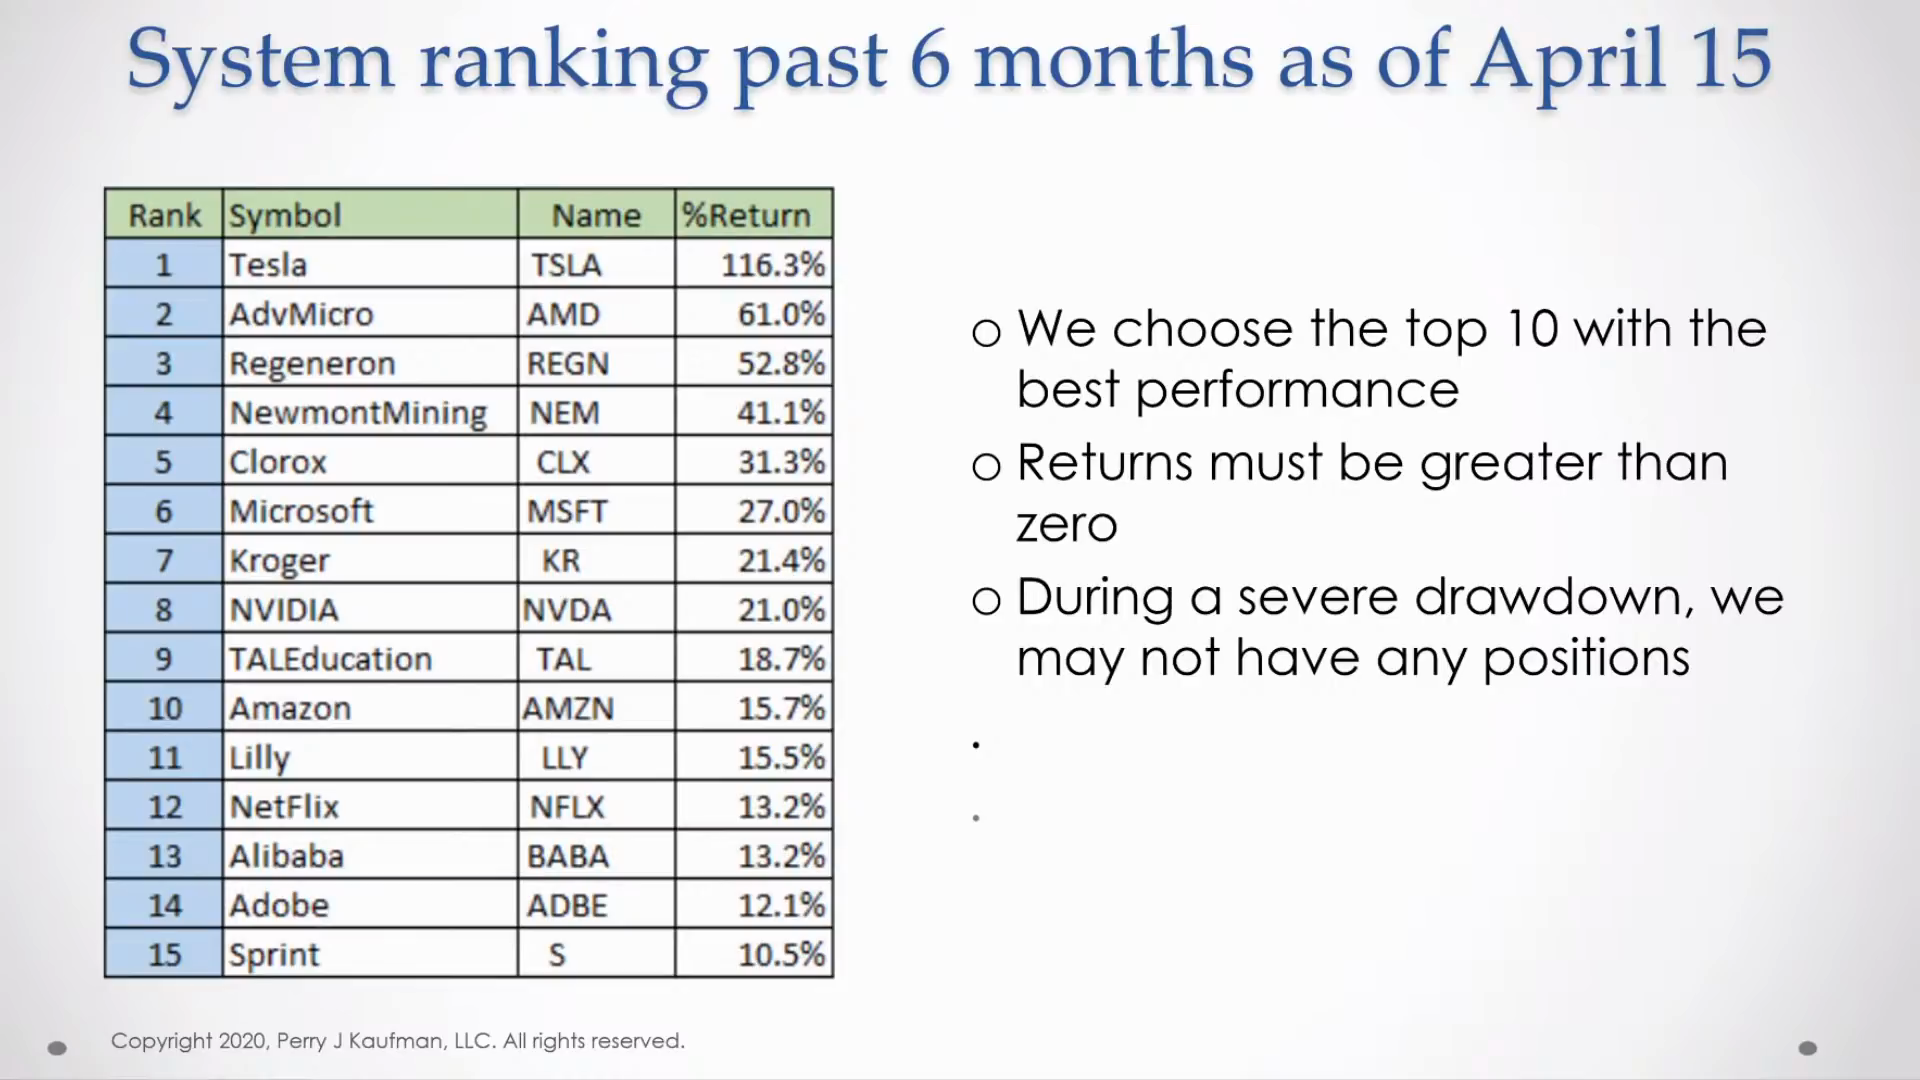 Best performing stocks table — ranked sector performance in the last real estate cycle.
Source: PSE Video
Best performing stocks table — ranked sector performance in the last real estate cycle.
Source: PSE Video