Summary
Gold sits at the intersection of four distinct analytic traditions, each explaining a different facet of its behaviour:
-
Long-wave / Kondratieff cycle framework — Nikolai Kondratieff (1925) identified ~50–60-year commodity super-cycles (K-waves) with commodity prices peaking at the wave top. The current K-wave top (~2026) should mark a structural commodity peak, after which K-wave downside dominates for a generation — but Kondratieff also documented that post-peak “prodigious gains” are possible for roughly a decade before the full downside asserts [Source: BBI April 29, 2026].
-
Austrian / hard-money / monetary-debasement school — Gold is a monetary anchor against currency debasement. In the post-1971 fiat era, central bank reserve rotation out of US Treasuries into gold signals institutional recognition that dollar-denominated assets carry inflation risk. This school predicts secular gold appreciation as fiat systems expand credit and erode purchasing power.
-
18.6-year real estate cycle context — Gold often runs counter to land: early and mid-cycle, equities and real estate absorb capital; gold drifts. Late cycle (Year 12–15), capital rotates from financial assets into hard commodities including gold. At cycle-end stress (margin calls, liquidity crises), gold can fall sharply as investors liquidate anything to cover. PSE (Phil Anderson, Akhil Patel) tracks this rotation as part of their applied advisory model [Source: 2026-03-26-notes-and-items; 2026-03-31-roadmap-update-march].
-
PSE’s 64-week Gann thesis — Technical Gann analysis links the 2006 and 2026 gold tops by exact time count (7,200 calendar days), projecting a 64-week sideways consolidation from March 2026 before the final bull-market leg up [Source: BBI Q&A April 29, 2026].
Current state (as of March 2026): Gold ran from ~2022 lows to ~4,000 — mirroring the May/June 2006 correction (25%) that preceded gold’s continued bull run into 2008. PSE expects higher prices in coming years as the cycle plays out.
Core Claims
- Gold peaked ~4,000 by late March 2026 [Source: 2026-03-31-roadmap-update-march].
- Similar to 2006: 25% correction in May/June before gold continued to new highs through 2008 [Source: 2026-03-31-roadmap-update-march].
- In times of stress, gold can fall as investors liquidate to meet margin calls [Source: 2026-03-31-roadmap-update-march].
- “Expect higher prices in the next few years” — post consolidation [Source: 2026-03-31-roadmap-update-march].
- Gold run was “clearly overdone” and retrace was overdue [Source: 2026-03-26-notes-and-items].
- Capital rotation from equities into commodities including gold occurs in late cycle stages [Source: 2026-03-26-notes-and-items].
- K-wave framework identifies commodity price peaks at K-wave tops (~1919, ~1974, ~2026), with “prodigious gains” possible for ~10 years post-peak before K-wave downside dominates [Source: BBI April 29, 2026].
Mechanism / How It Works
Gold’s behaviour across the 18.6-year cycle follows a phased pattern:
- Early and mid-cycle (Years 1–11): Equities and real estate outperform; gold drifts or consolidates as productive capital finds better returns in financial and physical assets.
- Late cycle (Years 12–15): Capital begins rotating out of financial assets into hard commodities. Gold and silver attract flows. Central banks — recognising fiat debasement risk — accelerate reserve shifts out of US Treasuries into gold (monetary-debasement channel).
- Cycle-top stress (Year 14–15, margin-call phase): Gold can fall sharply alongside equities as leveraged investors liquidate everything to meet margin calls. This is not a trend reversal — it is a liquidity-crisis flush.
- Post-peak (K-wave downside): Two competing forces — deflationary recession (suppresses gold) vs. monetary debasement (supports gold). Which dominates depends on central-bank response. Kondratieff’s original framework predicts a deflationary commodity collapse at K-wave top; the Austrian hard-money school argues QE and fiscal expansion will override deflationary pressures and produce a gold super-spike.
The counter-land dynamic: Gold often runs counter to land within the 18.6-year cycle. When real estate is absorbing capital (mid-cycle), gold is neglected; when real estate peaks and credit contracts, gold becomes a preferred store of value — but only after the initial margin-call flush clears.
64-Week Sideways Thesis (PSE, April 2026)
PSE identified a Gann pattern linking 2006 and 2026 gold price behaviour:
- Gold peaked May 2006, fell ~25% into June 2006, then moved sideways for 64 weeks before breaking out into March 2008. 64 = 8² (Gann square relationship).
- 7,200 calendar days from May 2006 gold top = January 2026 top — gold fell ~27% since.
- 72/27 number symmetry (72 × 2 = 144, a key Gann number).
- If the pattern repeats: gold moves sideways 64 weeks from the March 2026 low → June 2027 before its final bull-market leg.
- Akhil Patel confirmed: “consistent with what happened at the end of the last real estate cycle after 2006 … some consolidation, not particularly easy to trade.”
- DJI also peaked May 2006, fell ~8% into July, then climbed 64 weeks into the October 2007 top.
[Source: BBI Q&A April 29, 2026]
Predictions / Forecasts
- Gold to consolidate above ~$4,000 (recent low) before resuming bull. — status: pending
- Higher gold prices in coming years as cycle plays out. — status: pending
- 64-week sideways from March 2026 low → June 2027 breakout if 2006 analog holds. — status: pending
- Silver also mentioned in flash crash context (a couple weeks before Feb 16 email). — status: noted
- Akhil Patel (BBI May 27, 2026): gold has not yet seen its peak; expects a repeat of the 2008–2011 pattern (sideways, then a big run into the next K-wave secular concern phase). Sovereign-debt concerns and financial-system stress alone can absorb significant additional capital into gold. “I don’t see any reason why we might not get something similar to the run we had into 2008, sideways, then a big run into 2011.” — status: pending [Source: BBI Q&A, 2026-05-27]
- Phil Anderson (BBI May 27, 2026): commodity runs are over in direction but could drift sideways or modestly higher for another year. “All eyes now are on the housing and US building stocks.” The cycle baton is passing from gold/copper/oil to house-builder breakdowns (JHX inverse Mexican Pete). — status: pending [Source: BBI Q&A, 2026-05-27]
Applications
- Gold is not purely a safe haven — falls during margin-call / liquidity-crisis phases; distinguish the flush from the trend.
- Buy gold at lower prices or await next breakout after consolidation phase.
- Watch gold as a leading indicator for broader commodity rotation signal within the 18.6-year cycle.
- Central bank reserve behaviour (Treasury → gold rotation) is an institutional debasement signal, not just speculative.
Contradictions & Open Questions
- Gold’s correction may extend — hard to distinguish a normal pullback from a trend change without additional Gann confirmation.
- Gold run lasted longer than Akhil Patel expected before correcting — cycle timing is an approximation, not a clock.
- 64-week sideways thesis requires monitoring: breakout pattern needs confirmation by mid-2026.
- In a full land-price recession, gold falls too (margin calls, liquidation) — final leg up requires surviving the initial decline.
- Kondratieff’s framework predicts commodity peaks at K-wave tops with subsequent secular decline; the post-peak trajectory depends on whether monetary debasement (Austrian) or deflationary recession (Kondratieff) dominates.
- Ryan-Collins / credit-structural view does not directly address gold; open question whether credit contraction suppresses gold or drives debasement demand.
- Anderson vs. Patel (BBI May 27, 2026): Phil reads commodities (gold included) as over in direction with the late-cycle baton passing to house-builder breakdowns; Akhil sees a 2008–2011 analog with another major leg up still to come. The two are reconcilable only if the next gold leg comes via post-peak monetary debasement (Austrian channel) rather than continued cycle-up commodity demand. The Anderson “commodities top after DJI by 60–123 days” historical pattern (Cathy Stacey’s Dec 2025 charts — 1987, 1990, 2007) supports a modest further gold leg coinciding with the post-DJI-peak window. [Source: BBI Q&A, 2026-05-27; Cathy Stacey Dec 2025 commodity-timing extract]
Related Concepts
- 18.6-Year Real Estate Cycle
- Liquidity Cycle
- Bond Yields
- Sector Rotation
- Gann Time Counts — 7,200 days, 64 weeks, 8² relationships
- Kondratieff Wave — commodities (incl. gold) peak at K-wave top
- Cathy Stacey — PSE analyst who originated the gold 64-week thesis
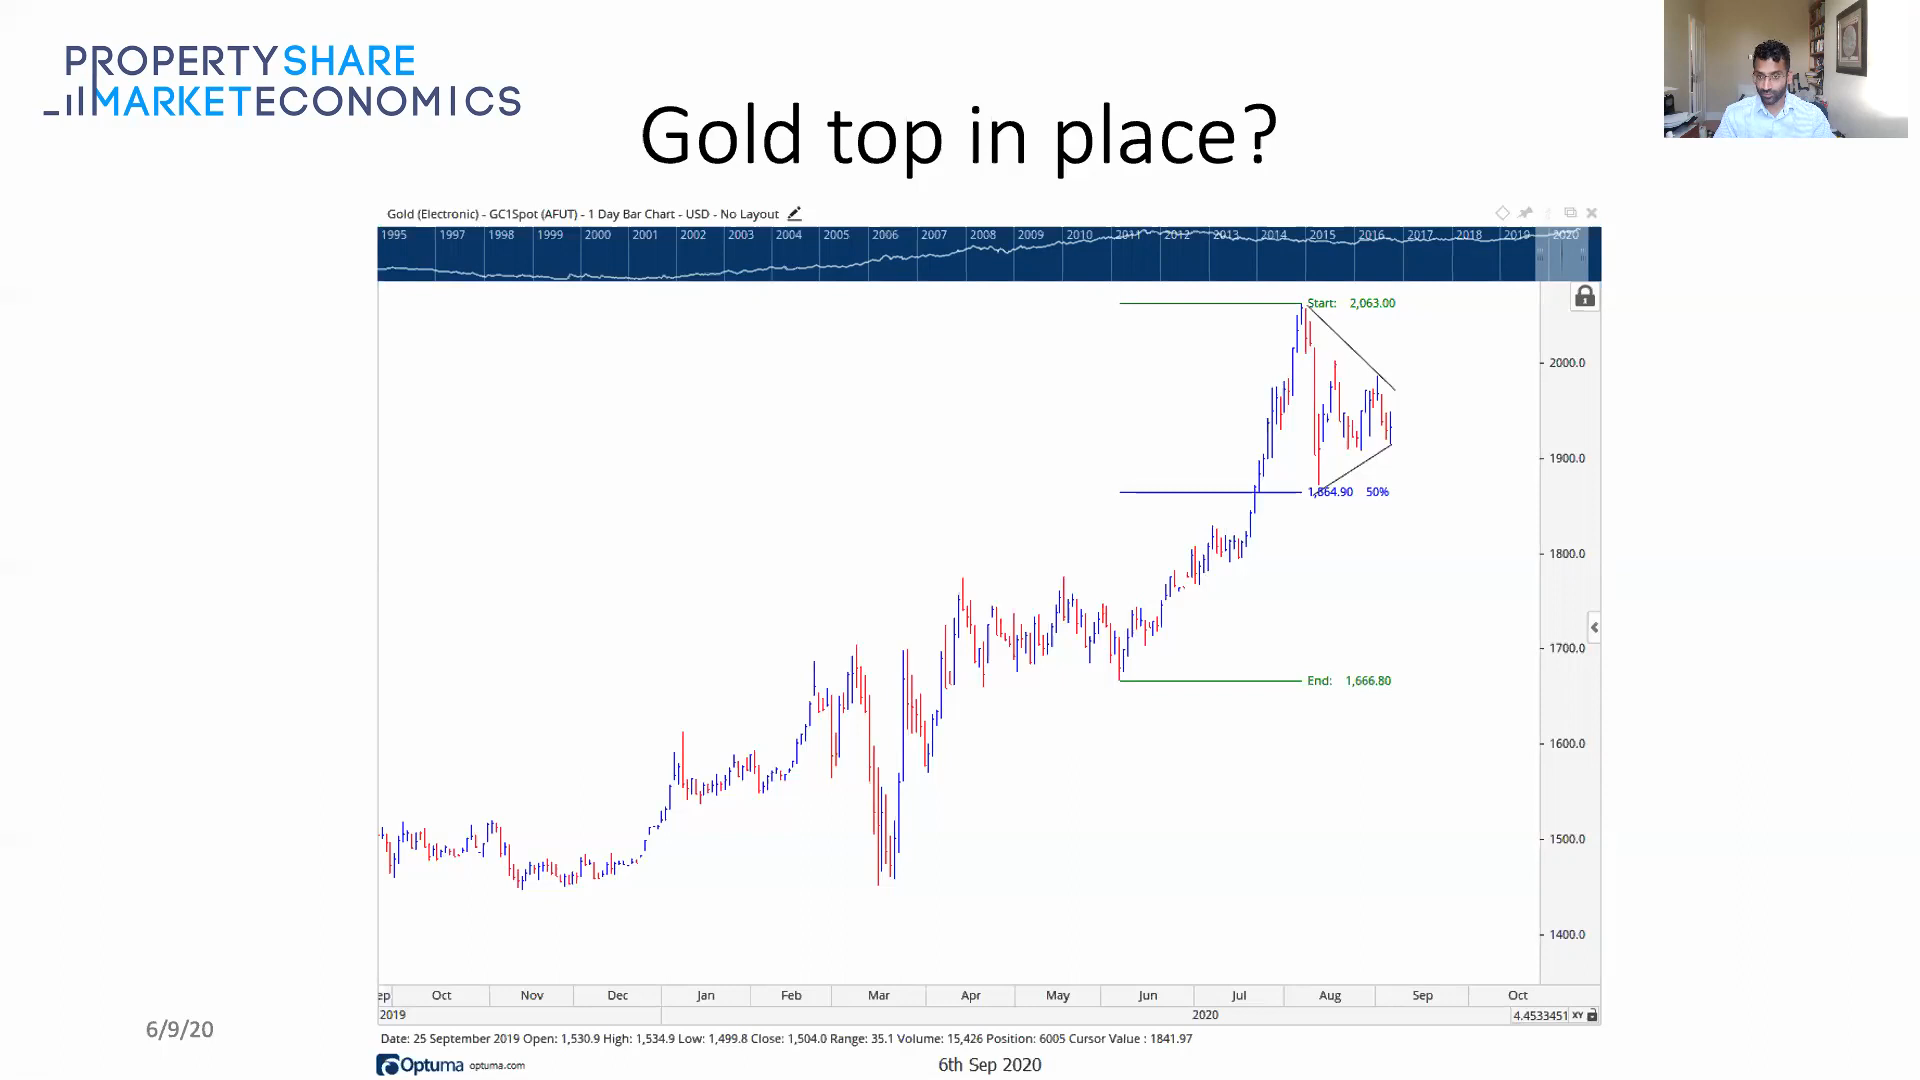 Gold price chart — long-run gold price with cycle annotations.
Source: PSE Video
Gold price chart — long-run gold price with cycle annotations.
Source: PSE Video
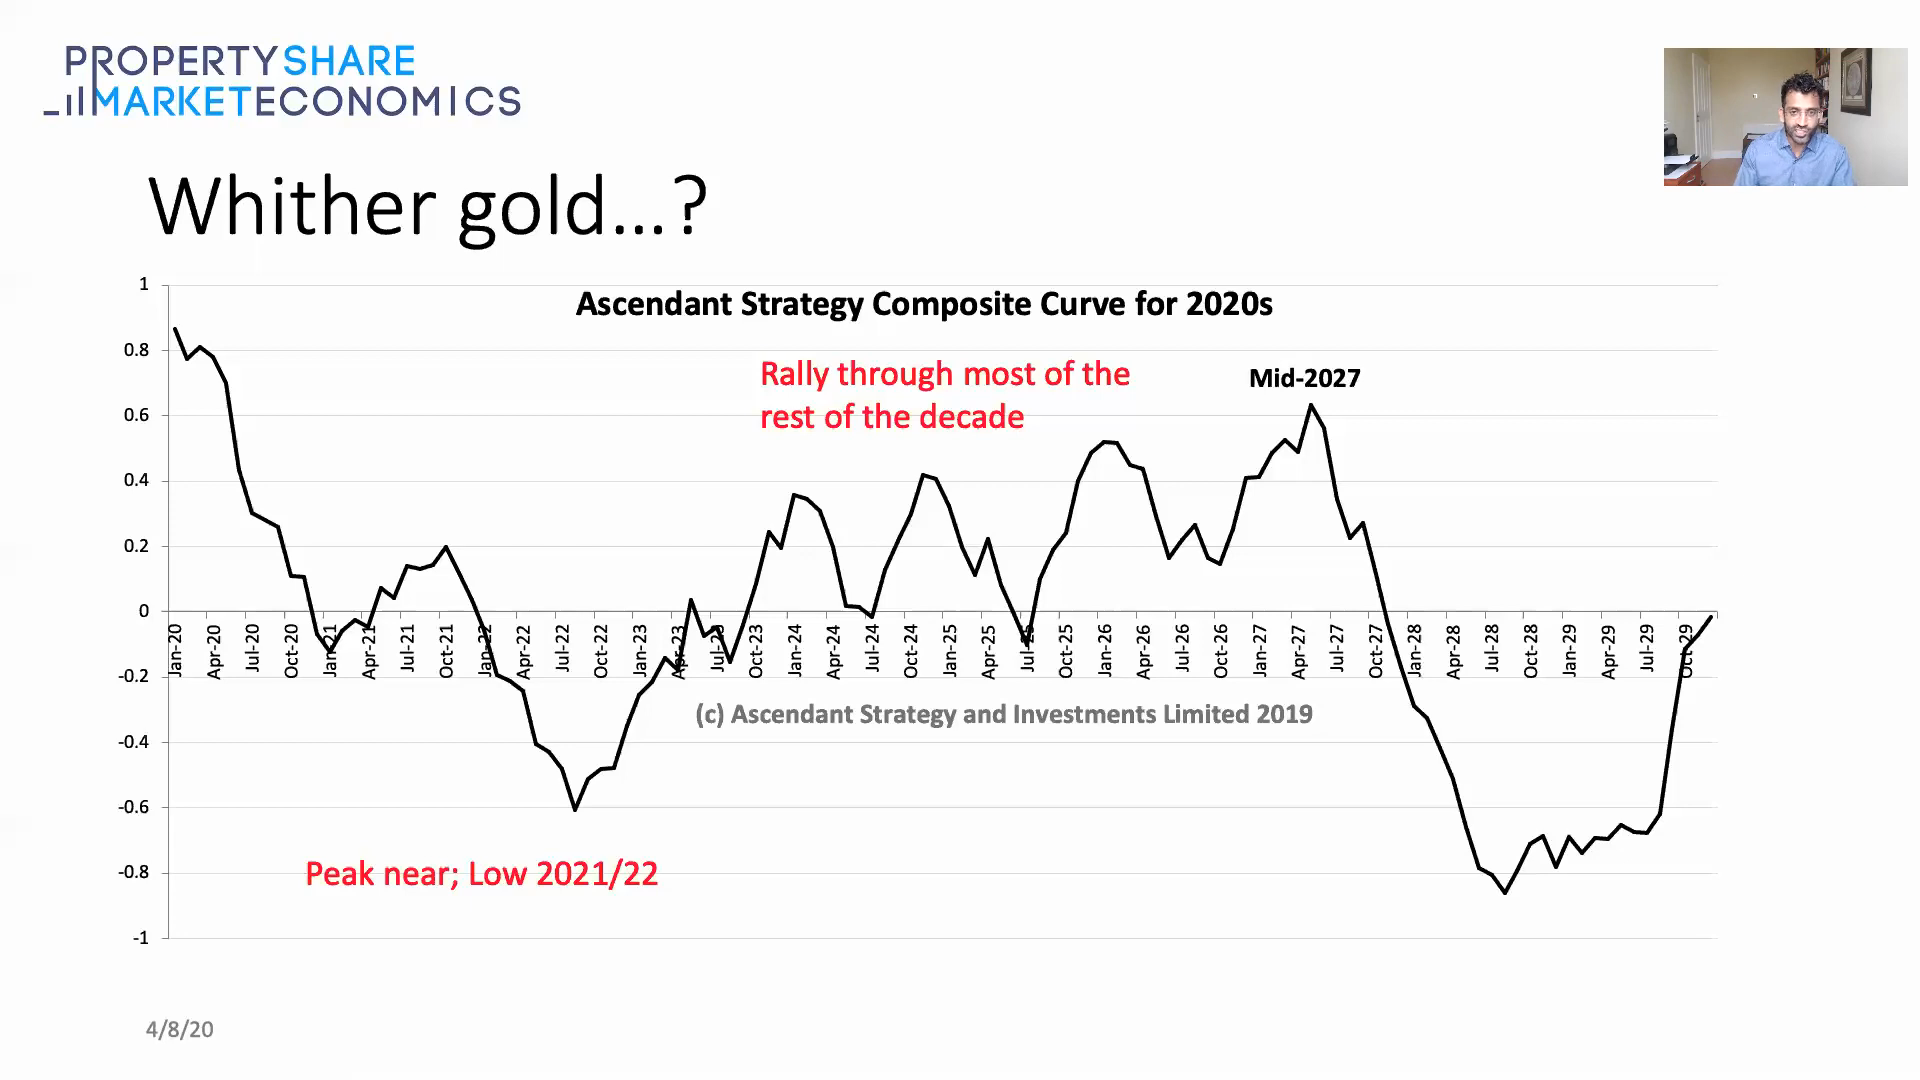 Gold prediction chart — PSE forecast model for gold through the cycle peak.
Source: PSE Video
Gold prediction chart — PSE forecast model for gold through the cycle peak.
Source: PSE Video
More Charts
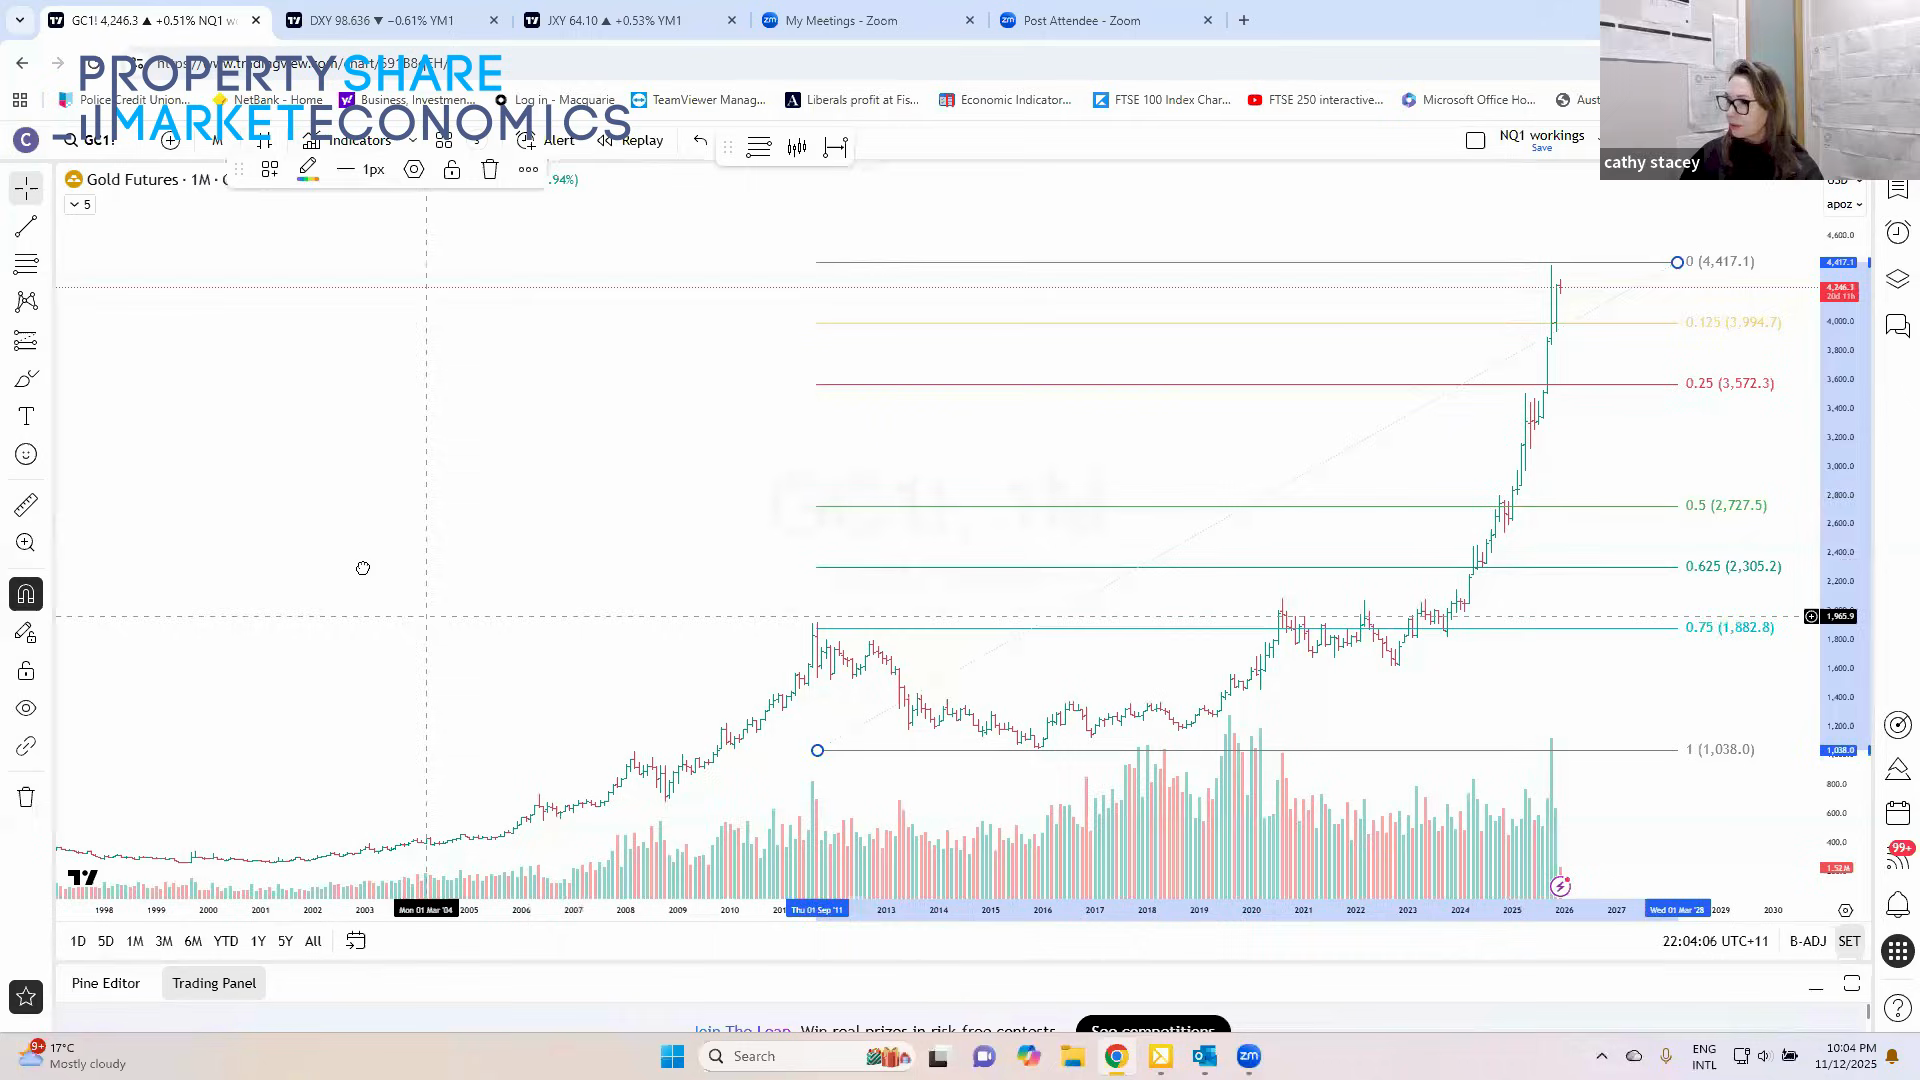
 Gold candlestick chart — technical chart of gold price movements.
Source: PSE Video
Gold candlestick chart — technical chart of gold price movements.
Source: PSE Video
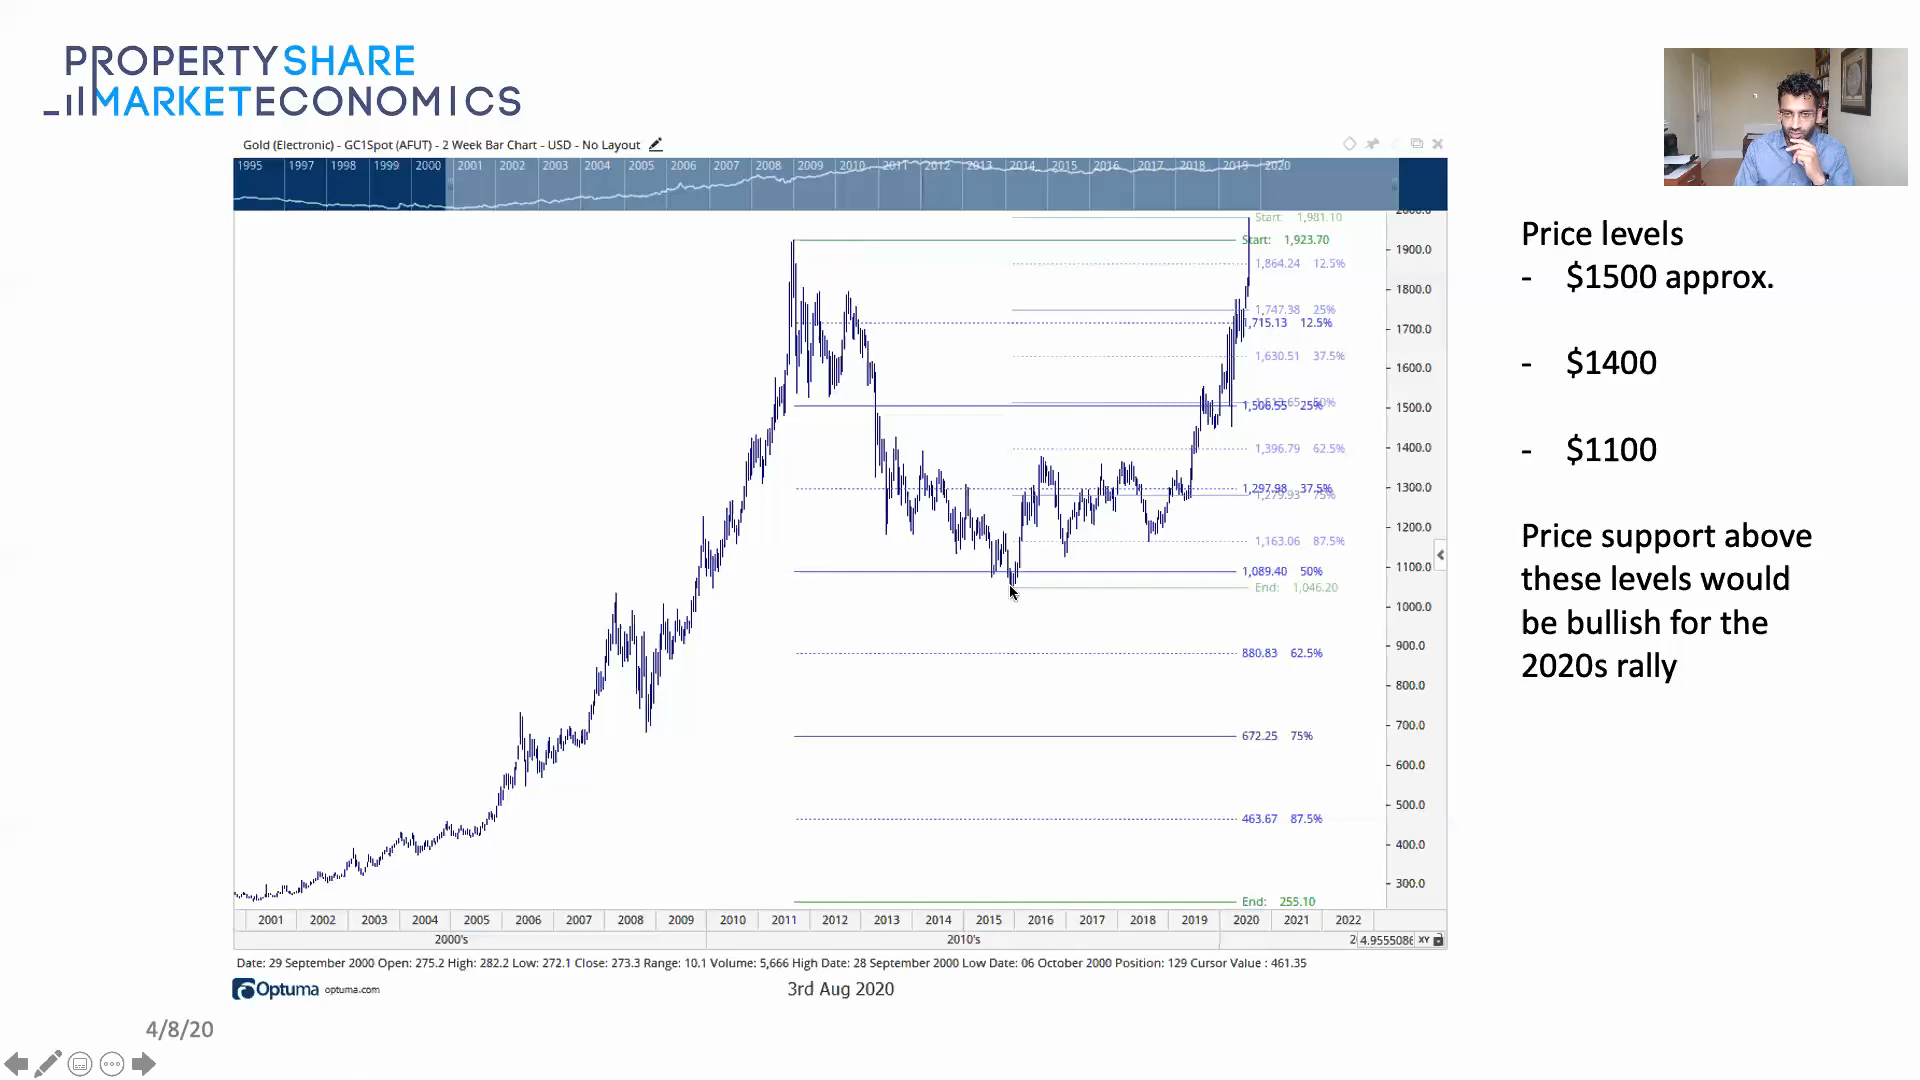
Gold prices over time — long-term gold price history with cycle annotations.
Source: PSE Video
 Gold stock market chart — trading chart of gold as investment vehicle.
Source: PSE Video
Gold stock market chart — trading chart of gold as investment vehicle.
Source: PSE Video
 Gold trend chart — technical analysis of gold price trends in current cycle.
Source: PSE Video
Gold trend chart — technical analysis of gold price trends in current cycle.
Source: PSE Video
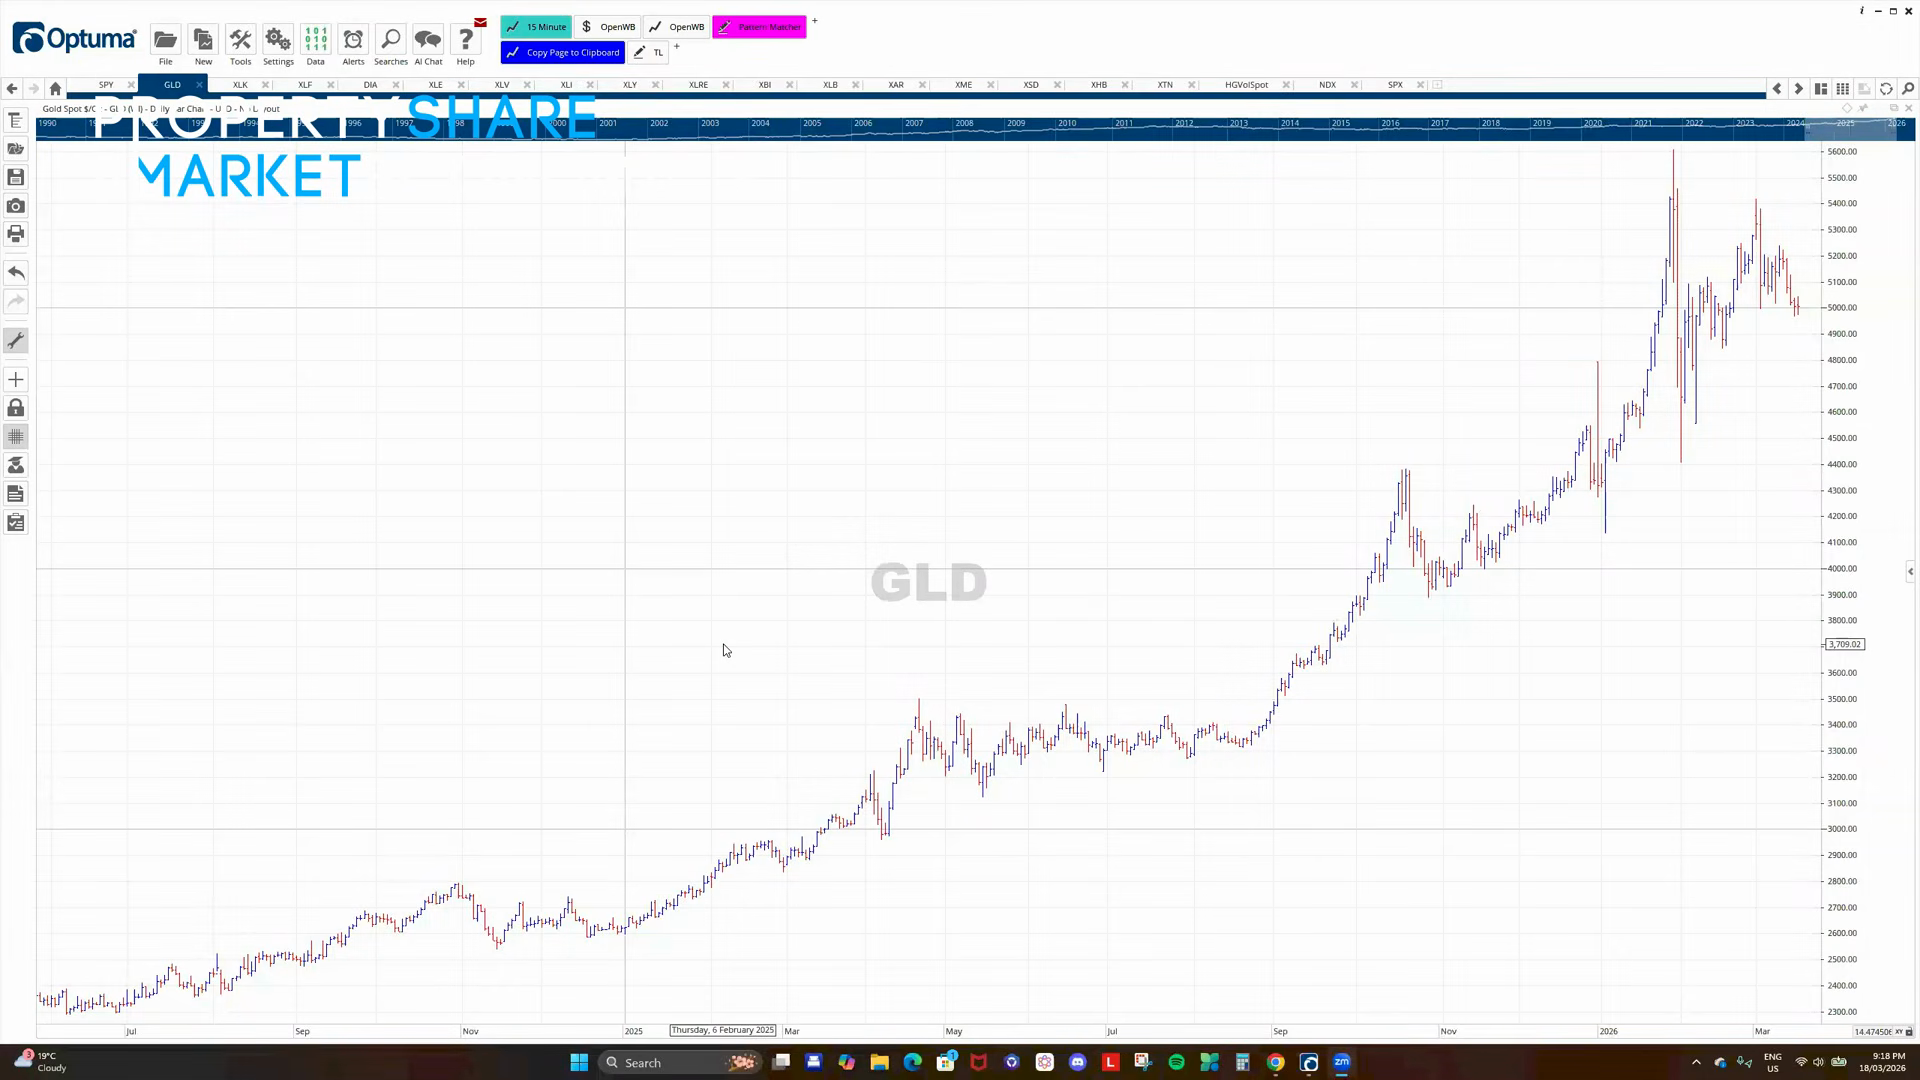 GLD ETF price chart — gold ETF tracking as practical investment reference.
Source: PSE Video
GLD ETF price chart — gold ETF tracking as practical investment reference.
Source: PSE Video
 Gold update slide — PSE commentary on current gold positioning and outlook.
Source: PSE Video
Gold update slide — PSE commentary on current gold positioning and outlook.
Source: PSE Video