Summary
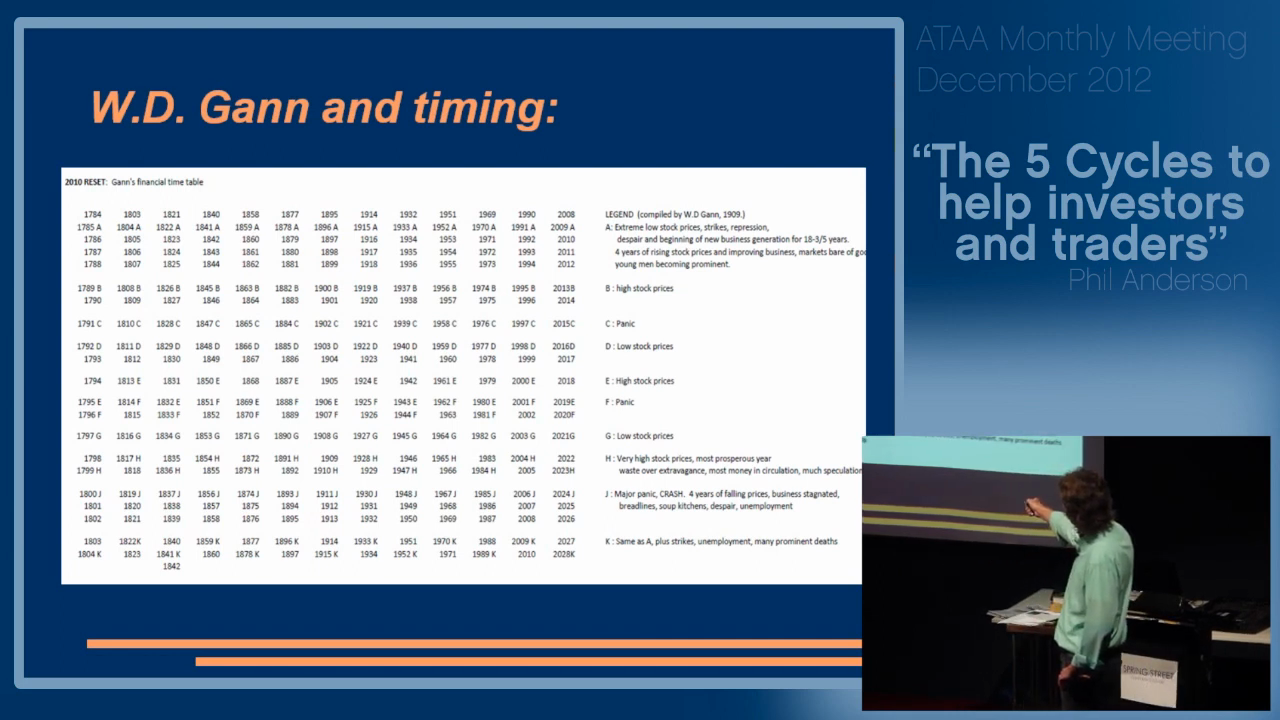
The Financial Timetable is PSE’s structured framework for overlaying historical year patterns on the current year to generate a forecast curve (“Roadmap”). The 2026 Roadmap compares current markets against 10, 20, 30, 40, 50, 60, and 90-year-ago market shapes (i.e., 2016, 2006, 1996, 1986, 1976, 1966, 1936). The key comparisons for 2026 are the “20/60 grey line” (1966 and 2006) — with 1966 being bearish (Vietnam/Fed tightening) and 2006 being bullish (Iraq war but up year). The number 60 and the 82-84 year cycle are also active in 2026. The decade-cycle overlay method traces to W.D. Gann’s own 1929 forecast methodology, which used 20-year (1909) and 60-year (1869) repeats.
Core Claims
- 2020-02-28-feb-2020-forecast-class-phil-session1-financial-timetable (2020-02-28): Phil presents the Financial Timetable in detail — A-K pattern within 18-year columns, origins in 1909 document. — confidence: high
- 2020-02-28-feb-2020-forecast-class-phil-sessions3b-4 (2020-02-28): Historical walk through every Financial Timetable column 1896-2030 with McWhirter North Node overlay. — confidence: high
- 2026-01-07-roadmap-2026-available (2026-01-07): 2026 Roadmap shows what happened 10, 20, 30, 40, 50, 60, 90 years ago. — confidence: high
- 2026-01-09-gann-dates-2026 (2026-01-09): Gann used 20-year (1909) and 60-year (1869) repeats for 1929 forecast. — confidence: high
- 2026-03-31-roadmap-update-march (2026-03-31): Markets now following the bearish 20/60 “grey line” (1966). — confidence: high
- 2026-03-31-roadmap-update-march (2026-03-31): 1966 pattern: 10% correction into March, lower high in April, further falls to September. — confidence: high
- 2026-03-31-roadmap-update-march (2026-03-31): 2006 pattern: up year, higher highs through year despite deteriorating economy and Iraq war. — confidence: high
Mechanism / How It Works
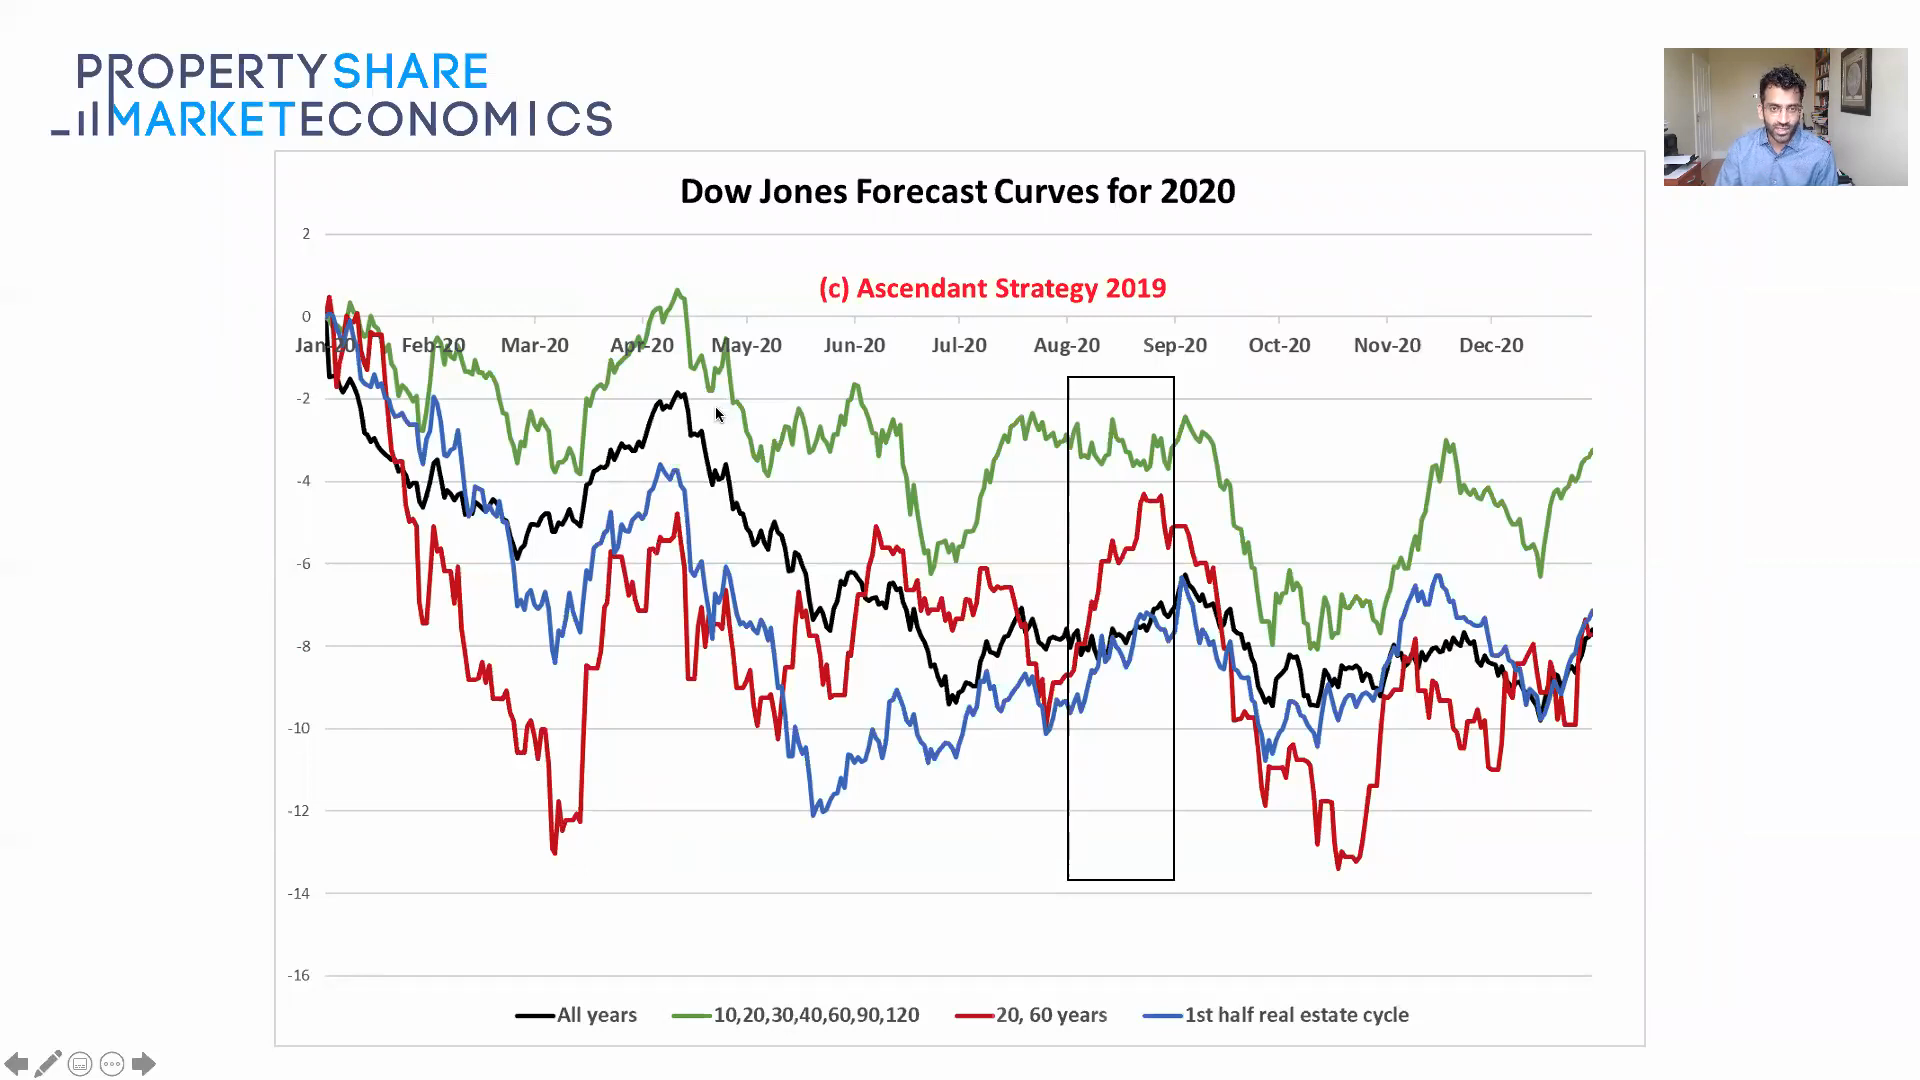
- PSE generates forecast “curves” by overlaying multiple historical year shapes on the current year
- The “red line” is the primary decade-cycle scenario; the “grey line” (20/60 year) is the bearish alternative
- Real market action is overlaid throughout the year to see which line it’s tracking
- Inflection months (e.g., April) are key decision points for which scenario is unfolding
2026 Scenario Status
- Through February: followed bullish curves correctly (Feb pause/dip called correctly)
- March (post Iran war Feb 28): shifted to tracking grey/bearish 20/60 line
- Critical test: April 2026 — if rally produces lower high → bearish (1966); if higher high → bullish (2006)
- April 22 update: Anderson reaffirms “red line” (bullish overall for 2026) despite breadth concerns. Roadmap forecast: late April peak → weakness and choppy Q2/Q3 → strong Q4. S&P 500 crossed 7,000 but with only 12 constituents at new highs. [Source: PSE Gann #07, 2026-04-22]
- April 28 update: Anderson identifies May 4 (seasonal solstice/equinox midpoint) as the key Gann date where “various forecast curves are aligned in seeing a peak soon that could mark a top until a fourth quarter rally sets in.” The Roadmap-warned change-in-trend is now reinforced by (1) Dow 30 Bubble Index red-line steady decline, (2) cyclical double-tops in XLB, Dow Transports, FCX, RIO, and (3) XLF/XLI below earlier-2026 highs. [Source: PSE Gann #08, 2026-04-28]
Historical Confirmed Predictions Using This Framework
- Foldvary 1997 → 2008: “1990 + 18 = 2008” — confirmed ✅ [Source: foldvary-depression-of-2008.pdf]
- Harrison 2005 → 2007-10: “By 2007, Britain and most other industrially advanced economies will be in the throes of frenzied activity in the land market… on the verge of the collapse that will presage the global depression of 2010.” — confirmed ✅ [Source: gaffney-role-of-land-markets-2009.pdf]
- Harrison 2022 → 2026 peak: “It will be in 2026, that is at the end of a 14-year cycle in house prices within a business cycle of 18 years.” ⏳ PENDING [Source: harrison-moneyweek-2026-interview-2022.md]
Applications
- Annual Roadmap is generated each January using this framework
- PSE subscribers use it as a “north star” to avoid reacting to short-term noise
- The red and grey lines serve as scenario brackets
Contradictions & Open Questions
- 1966 is an “odd-man-out” — Phil flagged that it doesn’t fit neatly into the typical decade cycle
- Markets currently tracking the grey line — outcome of April rally will resolve ambiguity
- The timetable framework draws on Gann’s methodology but its theoretical underpinning (why do 20-year and 60-year patterns repeat?) is not fully explained in PSE sources
Related Concepts
- Gann Time Counts
- 18.6-Year Real Estate Cycle
- McWhirter Cycles
- Seasonal Dates
- Geo-Austrian Synthesis — Foldvary’s theory built on Hoyt’s empirical foundation
- Fred Foldvary — the most precise historical predictor using the 18-year timetable
- Fred Harrison — his 2026 peak prediction aligns with PSE
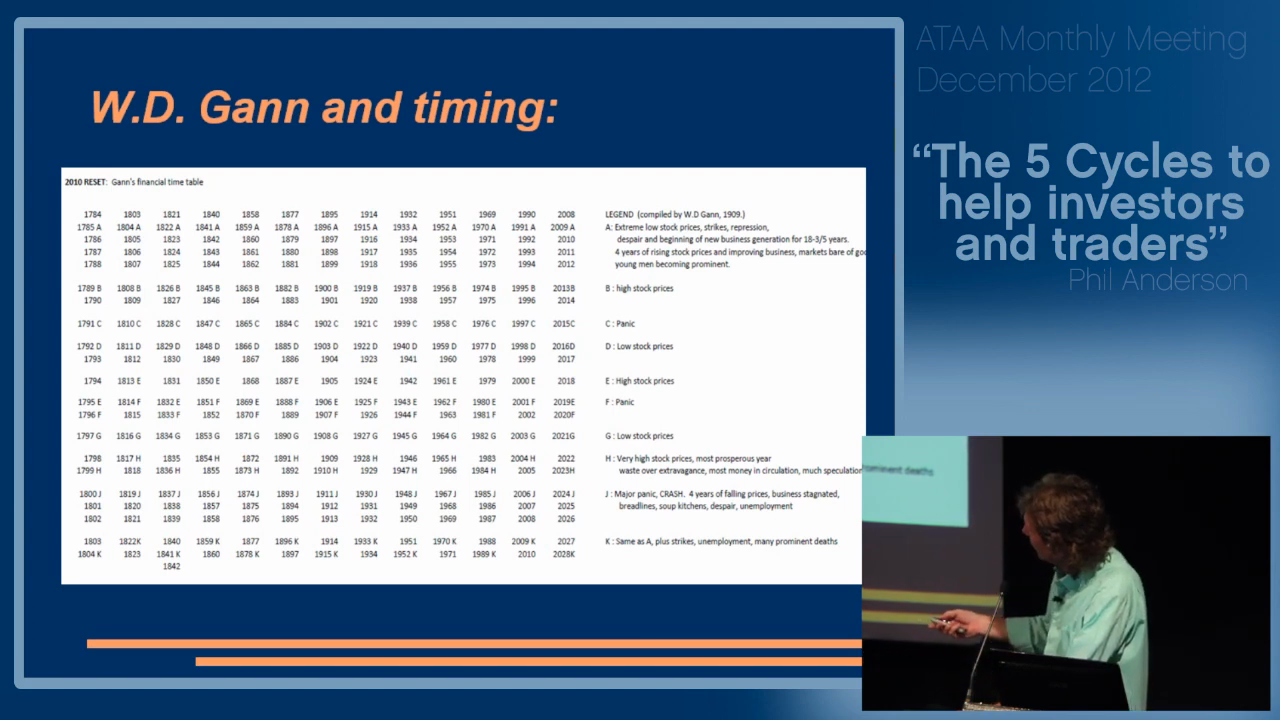 Gann Financial Timetable — years mapped with seasonal turning points and cycle overlays.
Source: PSE Video
Gann Financial Timetable — years mapped with seasonal turning points and cycle overlays.
Source: PSE Video
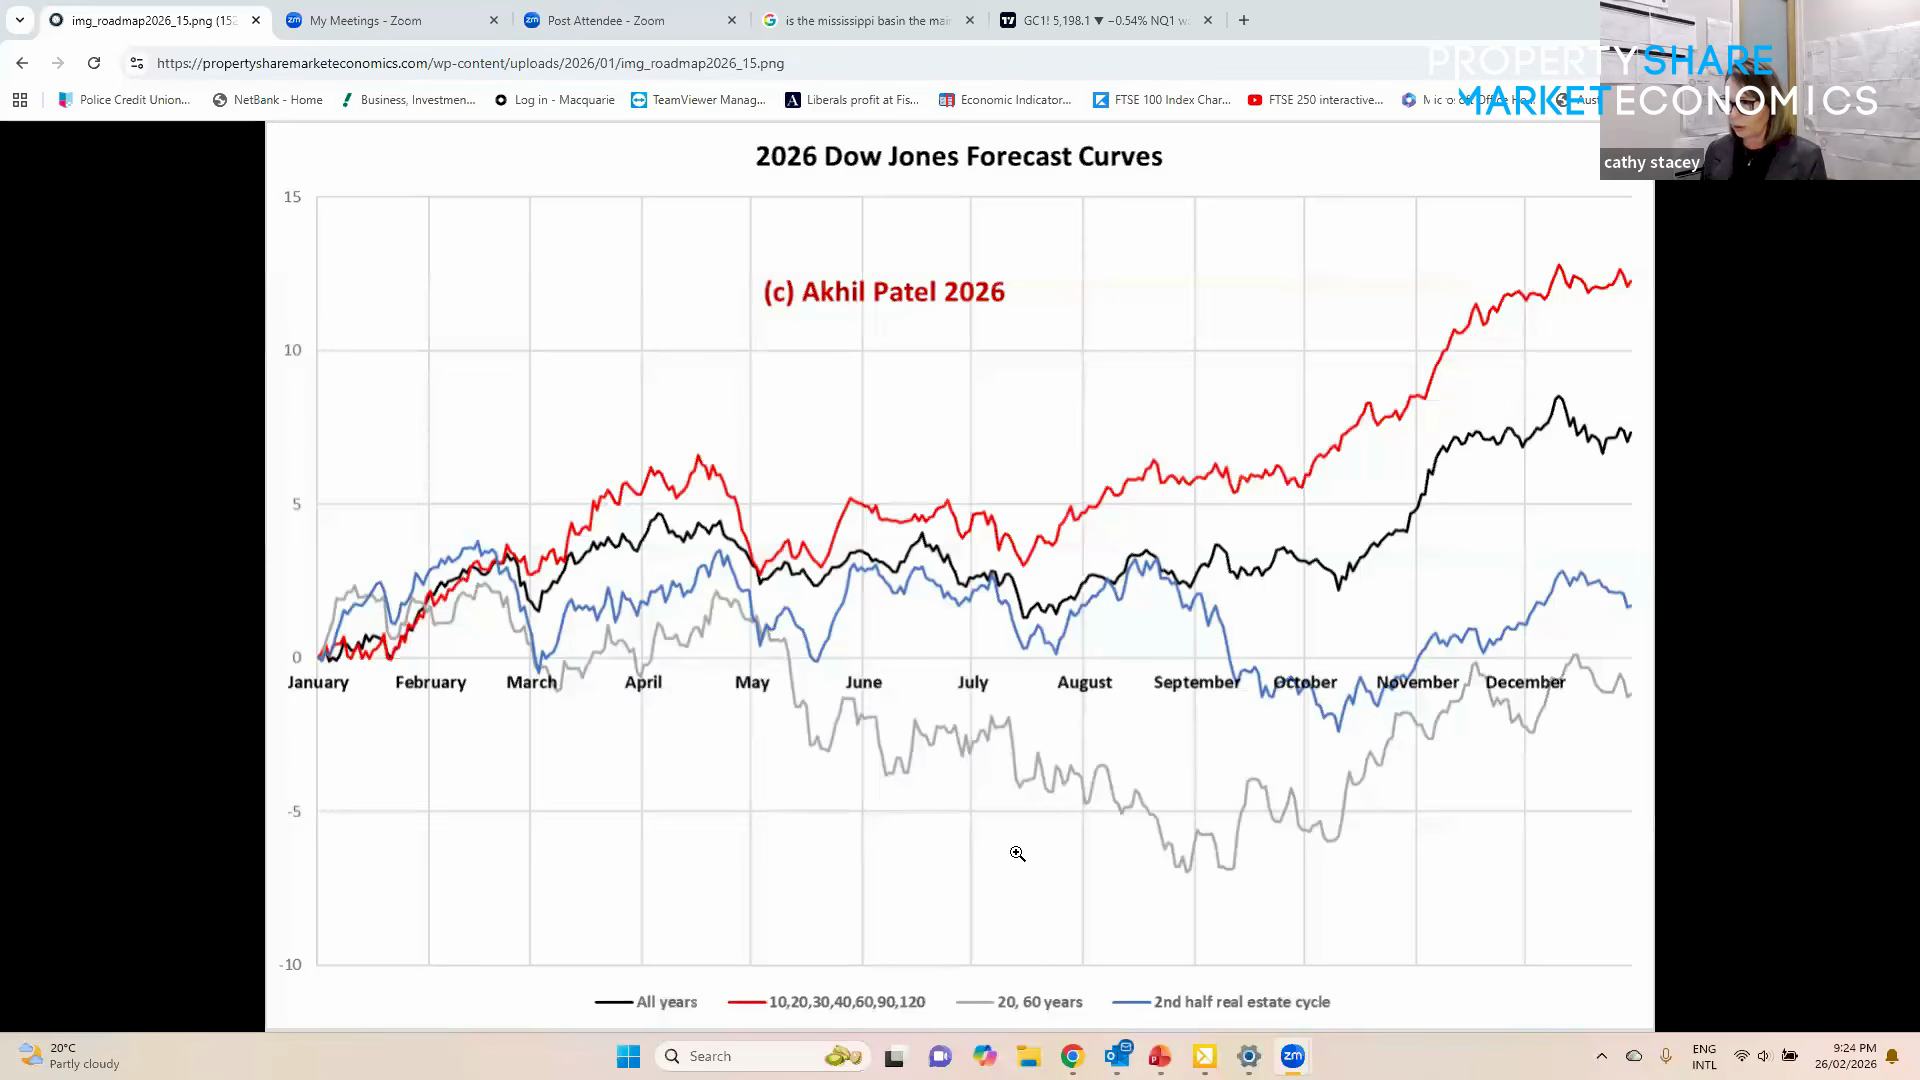 2026 Dow Jones forecast curves — current-year timetable projection (red/grey scenarios).
Source: PSE Video
2026 Dow Jones forecast curves — current-year timetable projection (red/grey scenarios).
Source: PSE Video
More Charts
 WD Gann’s Financial Information — foundational reference for the timetable framework.
Source: PSE Video
WD Gann’s Financial Information — foundational reference for the timetable framework.
Source: PSE Video
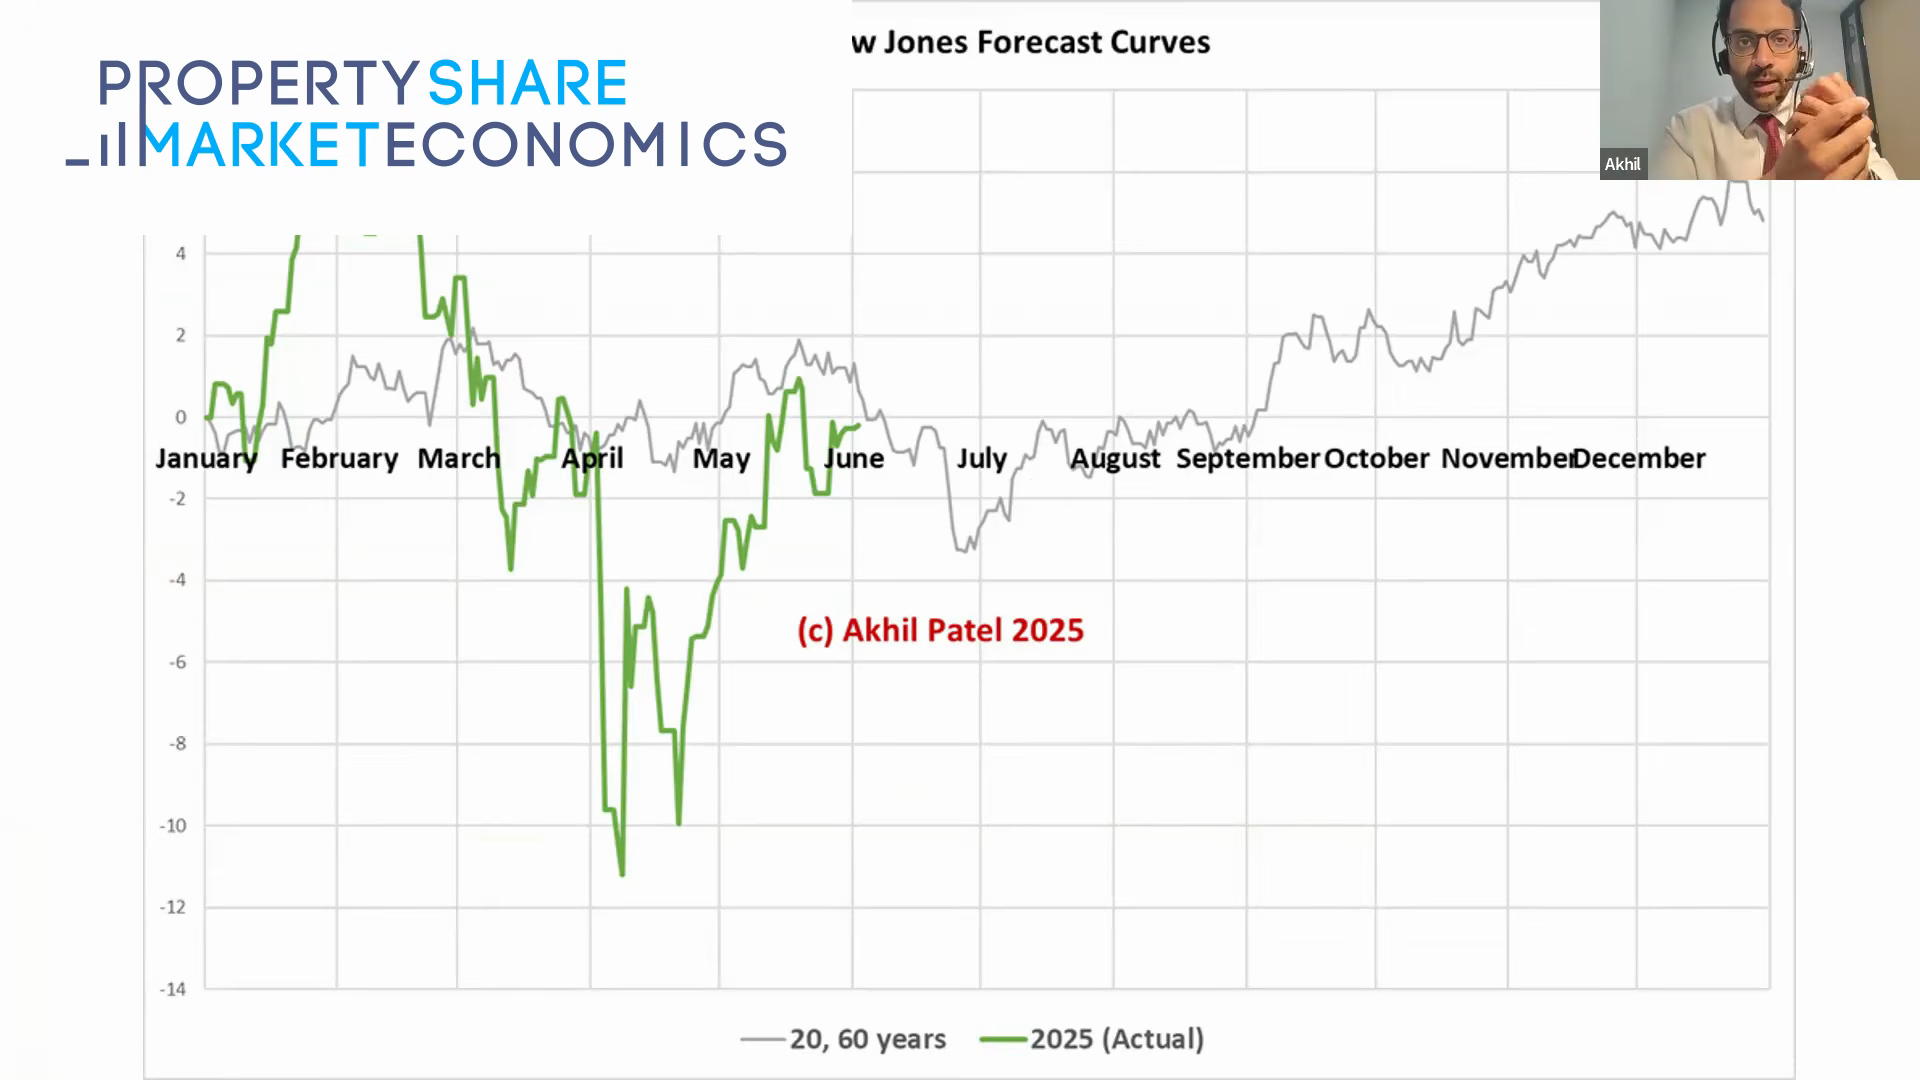 Dow Jones forecast curves for 2025 — composite curve projection used in PSE Roadmap.
Source: PSE Video
Dow Jones forecast curves for 2025 — composite curve projection used in PSE Roadmap.
Source: PSE Video
 2024 Dow Jones forecast curve — prior-year composite curve for validation.
 Dow Jones forecast chart — example of the composite curve methodology.
Source: PSE Video
Dow Jones forecast chart — example of the composite curve methodology.
Source: PSE Video
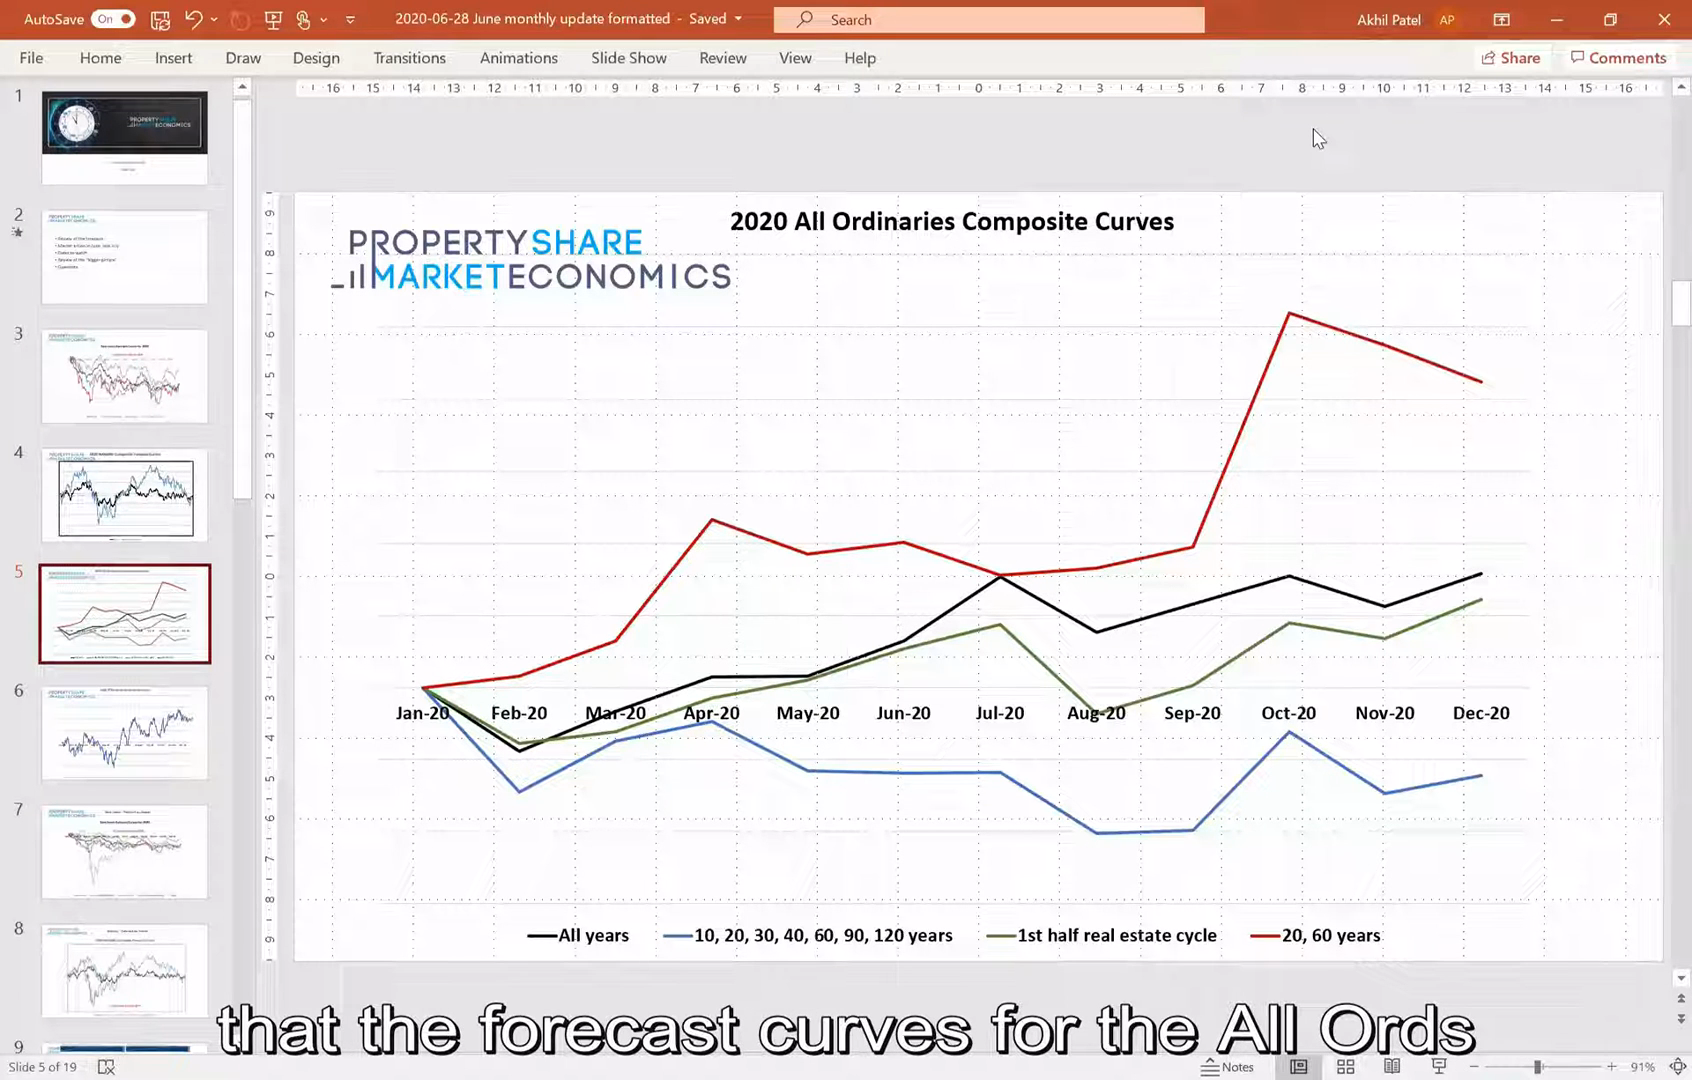 Composite curves — multiple decade overlays for the composite forecast approach.
Source: PSE Video
Composite curves — multiple decade overlays for the composite forecast approach.
Source: PSE Video
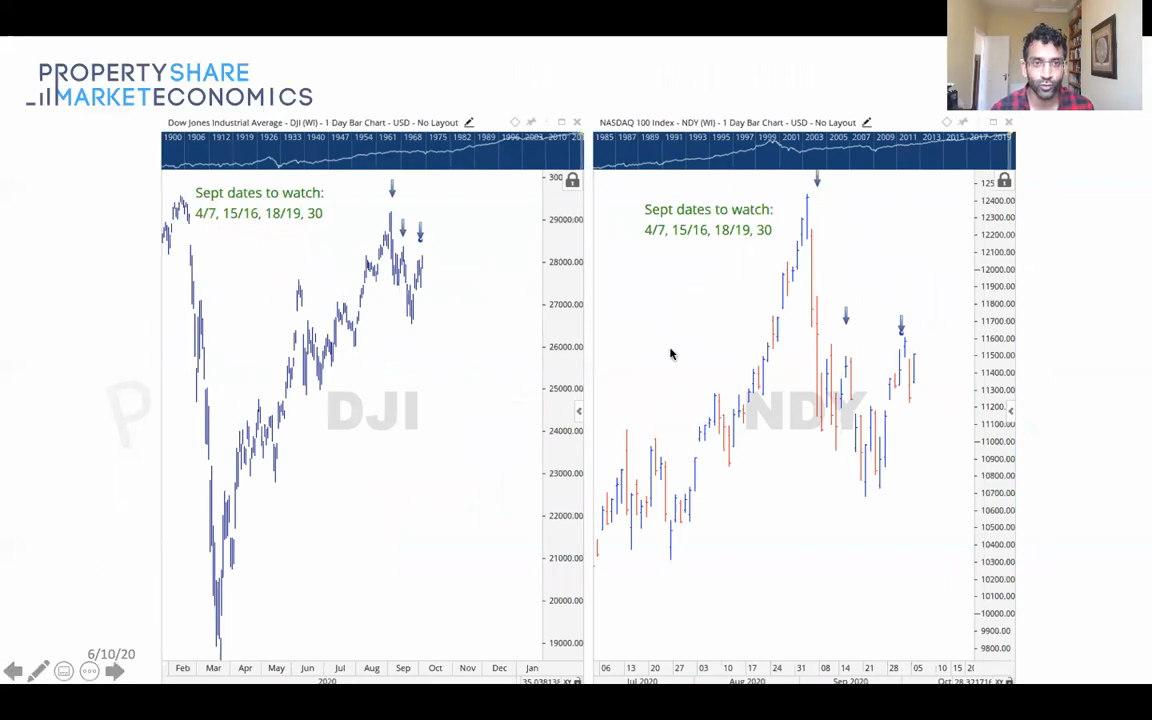 2020 Nasdaq forecast curves — how the timetable was applied during COVID markets.
Source: PSE Video
2020 Nasdaq forecast curves — how the timetable was applied during COVID markets.
Source: PSE Video