Summary
Private credit (non-bank lending) has grown explosively since 2008, absorbing capital away from regulated banks. It is deeply entangled with insurance companies and pension funds, creating hidden systemic risk. PSE identified it in 2022 as the likely vector for the end-of-cycle credit crisis. By early 2026, the collapse sequence had begun: Blue Owl → Blackstone BCRED → Black Rock TCP, with opacity preventing regulators from seeing the scale of the problem.
Core Claims
- 2026-03-05-canary-credit-coalmine (2026-03-05): Bank loans to shadow lenders rose 50%+ to $2.2T between 2019-2024 (Fed data). — confidence: high
- 2026-03-05-canary-credit-coalmine (2026-03-05): Blue Owl blocked redemptions Feb 2026 — sold assets to pension/insurance investors including Kuvare (own acquisition). — confidence: high
- 2026-03-05-canary-credit-coalmine (2026-03-05): 2025 collapse of First Brands Group and Tricolor Holdings preceded Blue Owl. — confidence: high
- 2026-03-23-private-credit-crumble (2026-03-23): Blackstone BCRED: redemption surge. Black Rock TCP: $25M loan to Infinite Commerce → zero. — confidence: high
- 2026-03-23-private-credit-crumble (2026-03-23): Claude AI obliterated SaaS valuations, triggering private credit stress on software loans. — confidence: high
- 2026-02-16-bitcoin-crash-end-of-cycle (2026-02-16): Great Maturity Wall: ~50-70T/year). — confidence: high
- 2026-03-05-canary-credit-coalmine (2026-03-05): Akhil wrote about private credit as “dress rehearsal for financial crisis” in 2022. — confidence: high
Mechanism / How It Works
- Post-2008, regulation pushed risk from banks to non-bank lenders (private credit funds)
- Private credit lends at high rates with opaque collateral; investors get high returns
- When collateral (often software stocks, property, private equity) falls, loans go bad
- But unlike banks, there’s no real-time transparency — regulators can’t see the problem
- Insurance companies absorbed the risk by buying private credit paper
- When redemptions are demanded, funds have no liquid assets to sell → blocked redemptions
- “Be First, Be Smarter, or Cheat” dynamic triggers avalanche
Key Evidence (Timeline)
- 2022: Akhil flags private credit as end-of-cycle systemic risk
- 2024: Banks’ loan commitments to shadow lenders = $2.2T (+50%)
- 2025: First Brands Group, Tricolor Holdings collapse
- Jan 2026: Bloomberg reports private credit’s massive position in software stocks
- Feb 2026: Blue Owl blocks redemptions; Blackstone BCRED redemption surge
- Mar 2026: Black Rock TCP $25M loan → zero
Applications
- Watch private credit/insurance sector news for early warning signals
- “Watch for obscure and not-well reported articles detailing difficulties” — PSE
- Reverse Mex Pete (descending triangle) pattern visible on credit company stocks (e.g., ASX:CCP)
- Sector is the likely trigger for broader market crisis
Contradictions & Open Questions
- ECB noted “data gaps” in Nov 2025 — exact scale of exposure unknown
- US Treasury Secretary Bessent expressed concern but said “thus far, very additive”
- How quickly does private credit stress spread to regulated banking system?
Related Concepts
Visual Evidence
Slides showing private credit, shadow banking, and the maturity wall dynamics.
 Financial markets data — credit market conditions and private lending trends.
Source: PSE Video
Financial markets data — credit market conditions and private lending trends.
Source: PSE Video
 Market chart with analysis — credit stress indicators in context of the cycle.
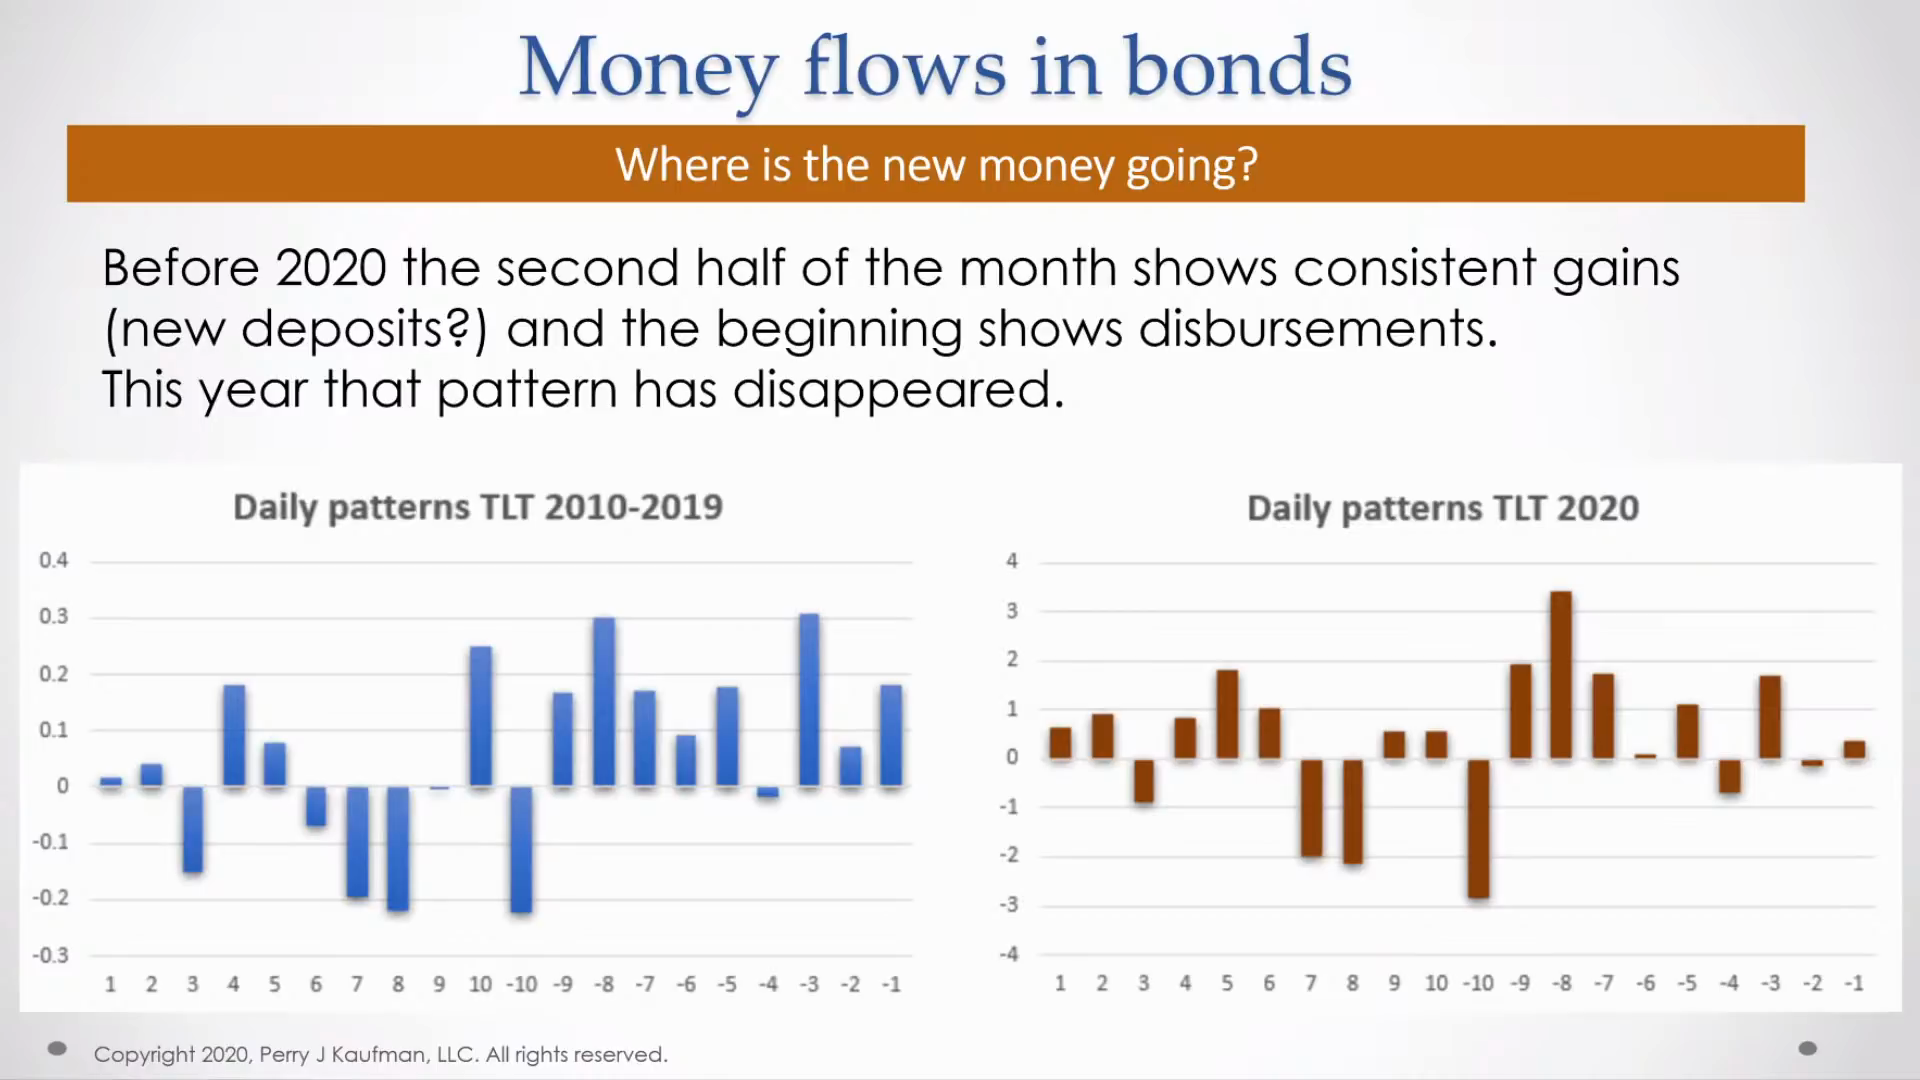 Money flows in bonds — showing credit market rotation and tightening dynamics.
Source: PSE Video
Money flows in bonds — showing credit market rotation and tightening dynamics.
Source: PSE Video
 Financial conditions index — private credit stress reflected in credit conditions.
Source: PSE Video
Financial conditions index — private credit stress reflected in credit conditions.
Source: PSE Video
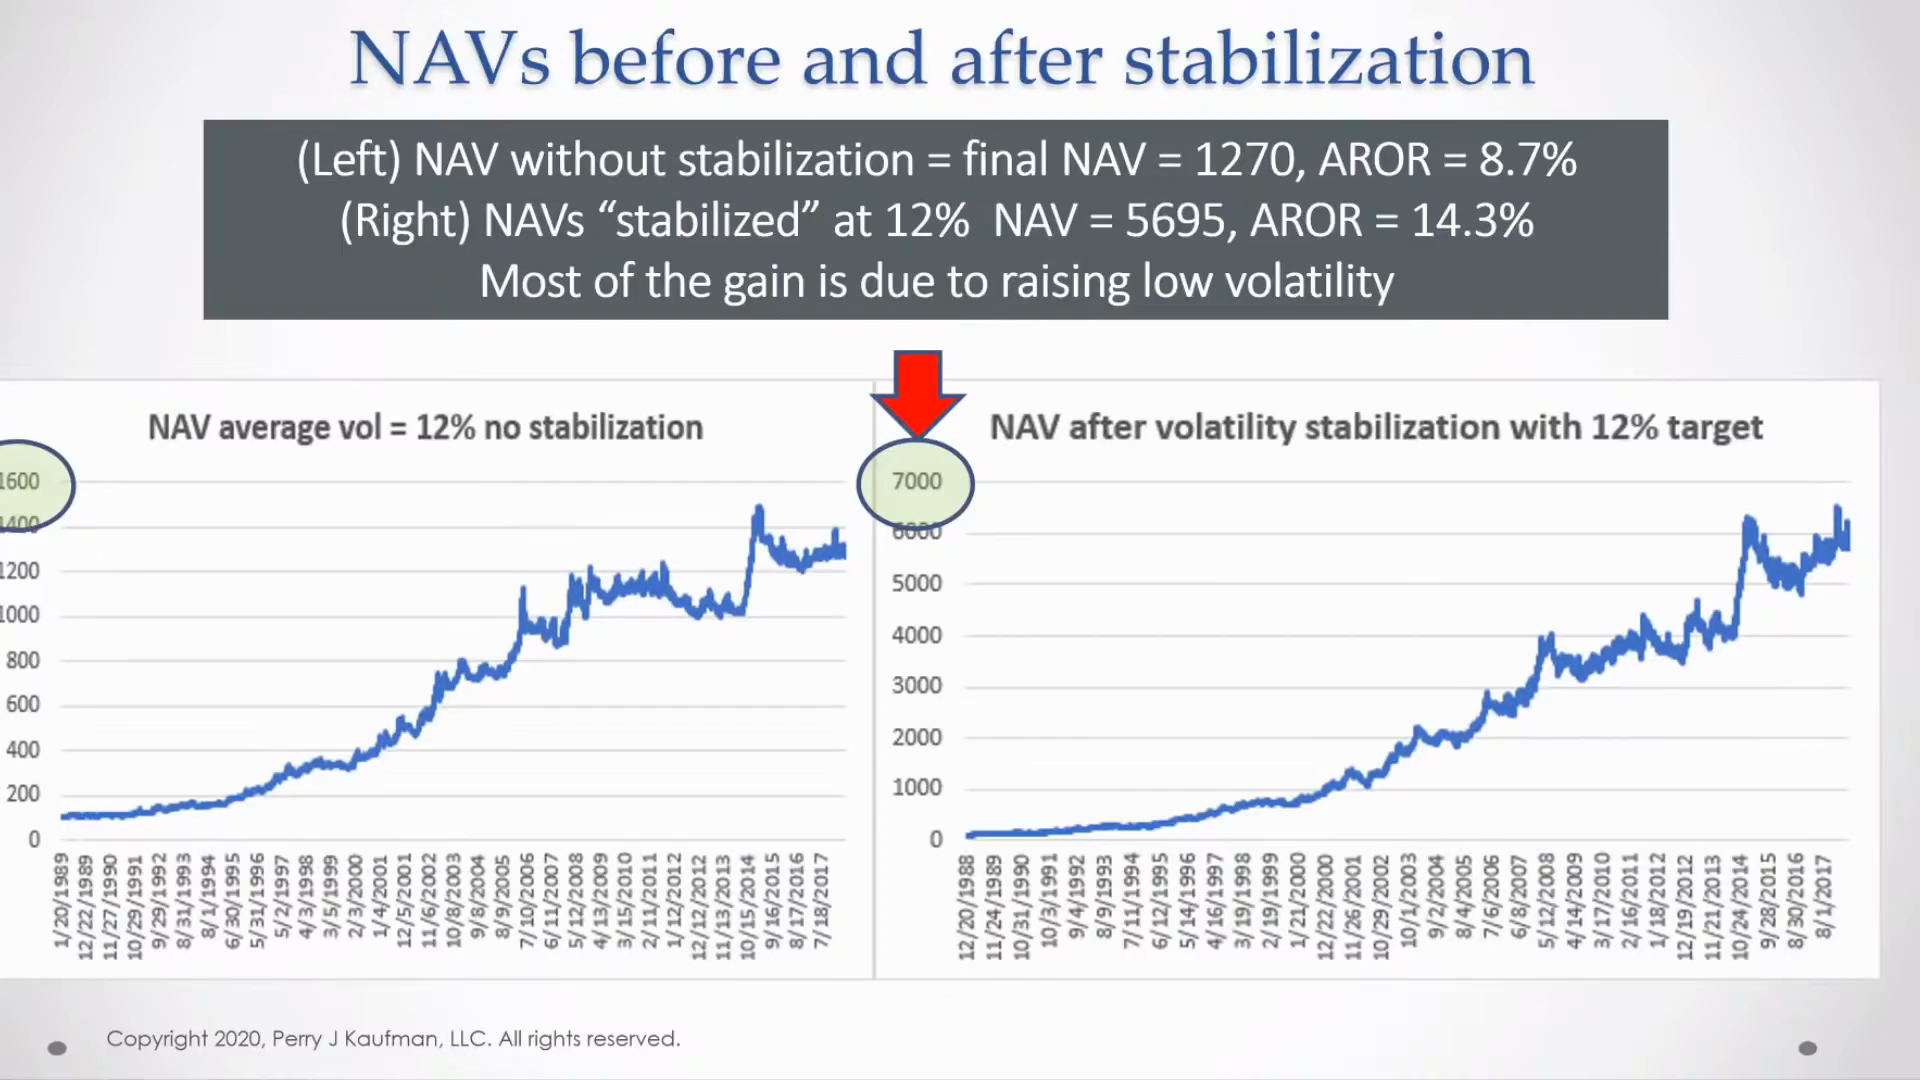 NAV comparison — fund valuation changes as private credit stress emerges.
Source: PSE Video
NAV comparison — fund valuation changes as private credit stress emerges.
Source: PSE Video