Summary
The Commodity Supercycle refers to long-wave (50-60 year Kondratiev wave, or ~30-year Saturn cycle) movements in commodity prices. PSE uses two overlapping frameworks:
-
Kondratiev Long Wave (~55-60 years): Discovered by Russian economist Nikolai Kondratiev studying 19th/20th century Western agricultural prices. Shows 25-30 year upswings and 25-30 year downswings. Peaks typically accompany wars (power struggle for resource trade terms).
-
Saturn 30-Year Cycle: Akhil Patel uses averaged 30-year commodity price segments (Saturn cycle) to generate commodity price forecasts. Track record: forecast April 2011 peak (actual was close), forecast fall to mid-2016 (confirmed), forecast subsequent sideways and then 2020s rise.
Key Historical Data Points (Kondratiev)
| Period | Phase | Driver |
|---|---|---|
| 1790-1815 | Up | Napoleonic Wars (UK peak ~1815) |
| 1815-1845 | Down | Post-war deflation |
| 1845-1866-73 | Up | US Civil War (US peak 1866, UK 1870s) |
| 1873-1900 | Down | Long Depression |
| 1900-1920 | Up | WWI (peak 1920) |
| 1920-1940 | Down | Great Depression |
| 1940-1980 | Up (interrupted) | WWII, Cold War, Vietnam |
| 1980-2000 | Down | Post-Cold War deflation, Asia crisis |
| 2000-2027? | Up | China BRI, US-China resource competition |
PSE Forecast for Current Cycle
- Low in commodity prices: ~2000 (Akhil and Phil)
- 25-27 years from 2000 low → 2025-2027 projected peak
- 30-year Saturn cycle confirmation of same range
- 18.6-year real estate cycle second half (post-2021) is historically bullish for commodities
- All three cycles (30-year, 60-year, 18.6-year real estate) pointing in same direction → very bullish outlook for 2020s commodities
Commodity vs. Stock Market Sequencing
- In every real estate cycle, commodities peak AFTER the stock market (confirmed 1974, 1990, 2008)
- When money exits stocks in 2026, it may flow into commodities → potential final blow-off in commodities 2026-2027
- Gold: tends to surge at end of real estate cycle (banking fears)
Phil Anderson’s End-of-Cycle Sequence (BBI May 27, 2026)
Phil restated his canonical commodity-and-equity peak sequence (referring back to Gann emails #24 and #27 from 2025):
House builders peak first → copper rising → gold → silver → oil → usually the market.
As of late May 2026, the commodity runs are largely played out in direction (though they may drift sideways or modestly higher for another year). The cycle baton has passed to house builders — James Hardie (JHX) is forming an inverse Mexican Pete (see Mex Pete Trading Style); a break of JHX below $17 and a parallel break of the US house-builders index would confirm the Real Estate Cycle Peak is on track.
[Source: BBI Q&A, 2026-05-27]
Cathy Stacey’s Commodity-Timing Reference (Dec 2025 → May 2026 extract)
Cathy’s December 2025 commodity-timing extract (reissued with the May 27 2026 BBI recording email) gives the quantified lag between DJI peak and commodity peak across prior cycles:
| Cycle | Asset | Top relative to DJI |
|---|---|---|
| GFC (2007) | S&P GSCI commodity index | Topped ~8 months AFTER DJI |
| 1989/90 RE-cycle | S&P GSCI commodity index | Topped 63 days AFTER DJI |
| 1987 panic | Gold | Topped 91 days AFTER DJI |
| 1989/90 RE-cycle | Gold | Lower high 63 days AFTER DJI |
| GFC (2007) | Gold | Topped 123 days AFTER DJI |
The K-wave nuance: in the 1970s (final up-phase of the previous K-wave), gold actually peaked before DJI — by Jan 1973 DJI top, gold was already rising back to higher highs. The 2025–26 setup, by contrast, sits in the first decade of the current K-wave up-phase, making the 1987/1990/2007 commodities-AFTER-DJI pattern the better analog than the 1972 inversion. Cathy: “So we have 60 days, 90 days and 120 days. Interesting. But this is just two real estate cycles.”
[Source: BBI Q&A, 2026-05-27; Cathy Stacey, Dec 2025 commodity-timing extract attached to May 27 2026 recording]
Great Wave Context
David Hackett Fischer’s “The Great Wave” (1996) documents ~1000 years of UK commodity prices with alternating centuries of price revolution (up) and flat/falling periods. His thesis: the 20th century’s great price revolution may be followed by near-flat commodity prices through much of the 21st century. PSE acknowledges this as a long-term constraint even while bullish on the 2020s Kondratiev upswing.
Key Features of Kondratiev Upswing
- New countries enter global trade orbit (China WTO 2001 = main driver of 2000s)
- Technology application accelerates (internet technology applied to supply chains, etc.)
- Great powers compete for resource trade terms → geopolitical tension/war
- Political turbulence as old industries decline
- Current dominant “new countries” entering orbit: India, Africa
Key Sources
- 2020-02-28-feb-2020-forecast-class-akhil-commodities — Akhil’s commodity forecast with 30-year and Kondratiev analysis
- 2020-02-28-feb-2020-forecast-class-phil-introduction — Phil’s opening covering Great Wave + Kondratiev
- 2020-02-28-feb-2020-forecast-class-akhil-grand-cycle — Akhil on commodities accompanying second half of real estate cycle
- harrison-interview-part4-2026 — Fred Harrison on commodity cycles and 2026
Open Questions
- Will the 2020s commodity upswing be muted by the Great Wave (21st century flat prices) or will it still be a significant peak?
- Is gold’s behavior at cycle end (banking crisis = gold spike) consistent with the Kondratiev thesis or an exception?
- Does the Belt and Road Initiative represent an unusually large demand driver that could make the 2020s cycle stronger than average?
Visual Evidence
Slides from PSE content showing commodity supercycles, price trends, and the 30-year commodity cycle.
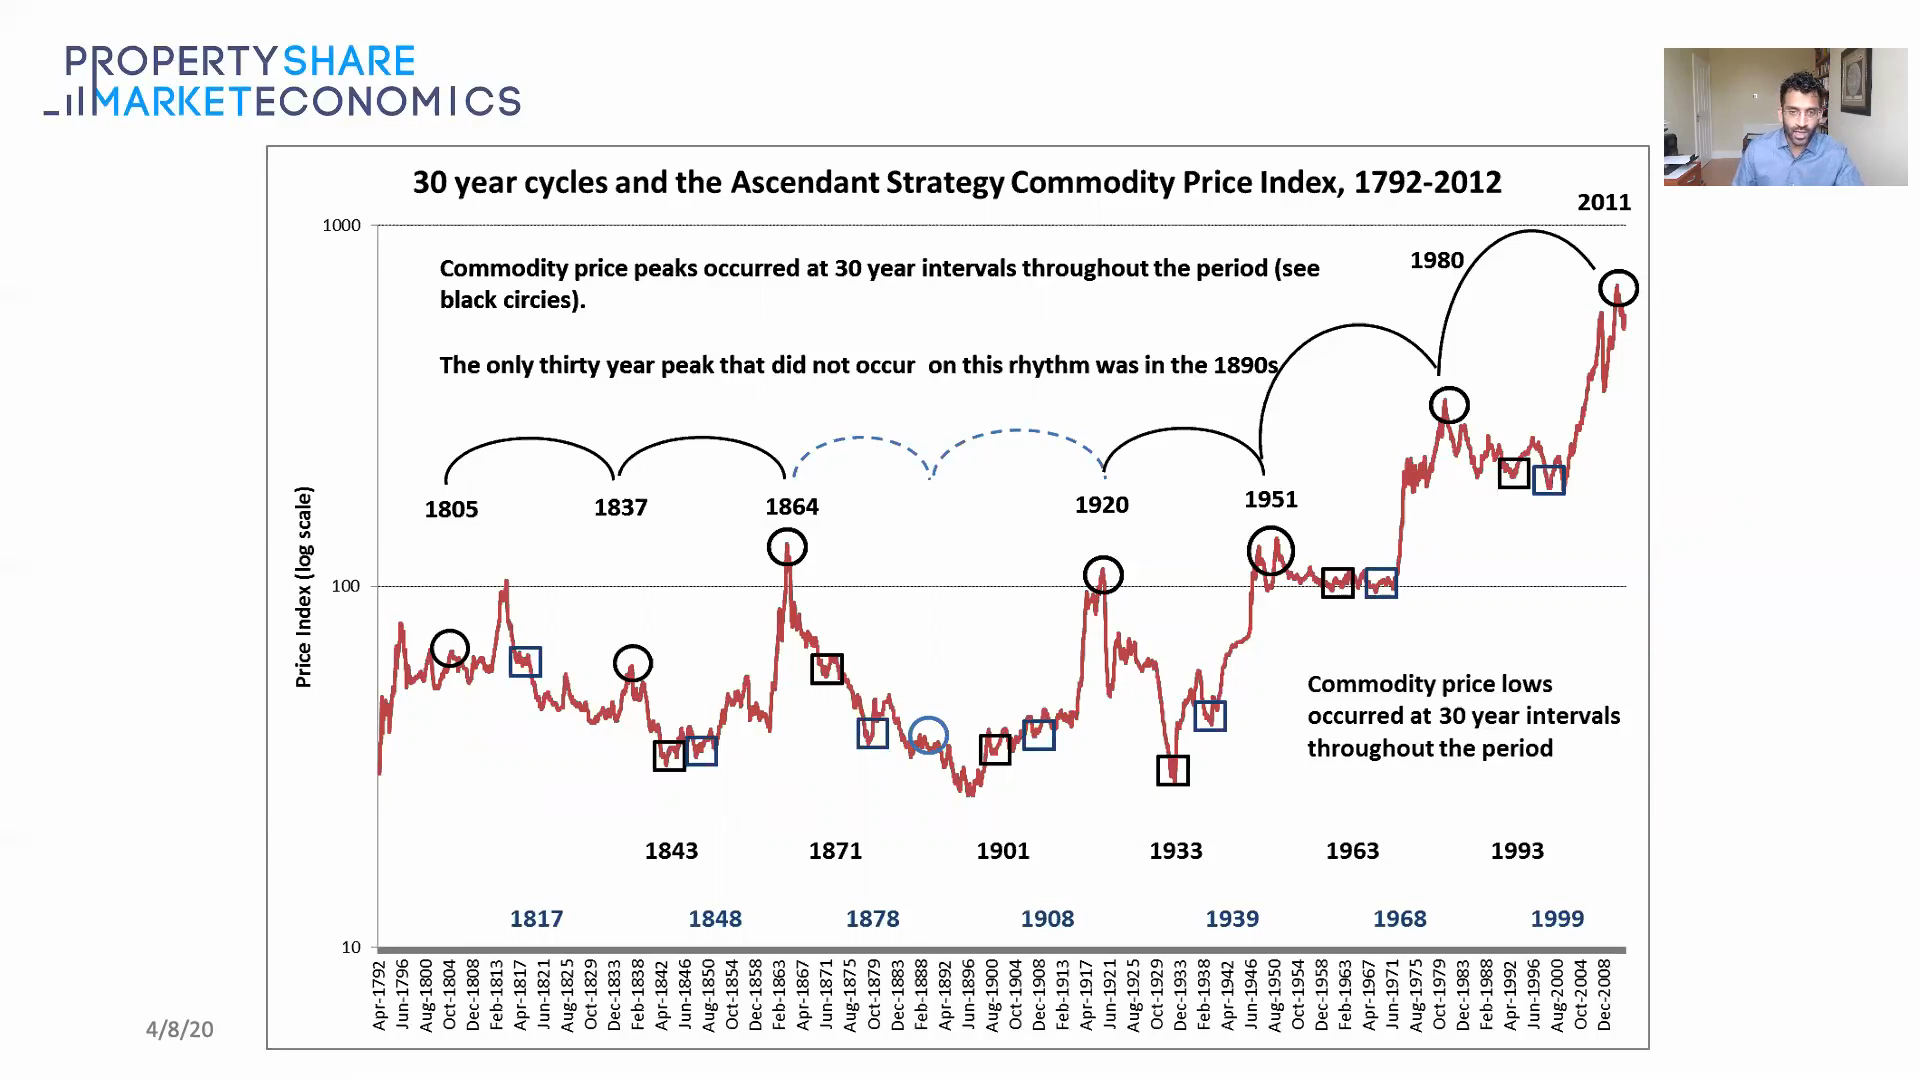 Commodity price trends — 30-year cycles — historical commodity cycle chart.
Source: PSE Video
Commodity price trends — 30-year cycles — historical commodity cycle chart.
Source: PSE Video
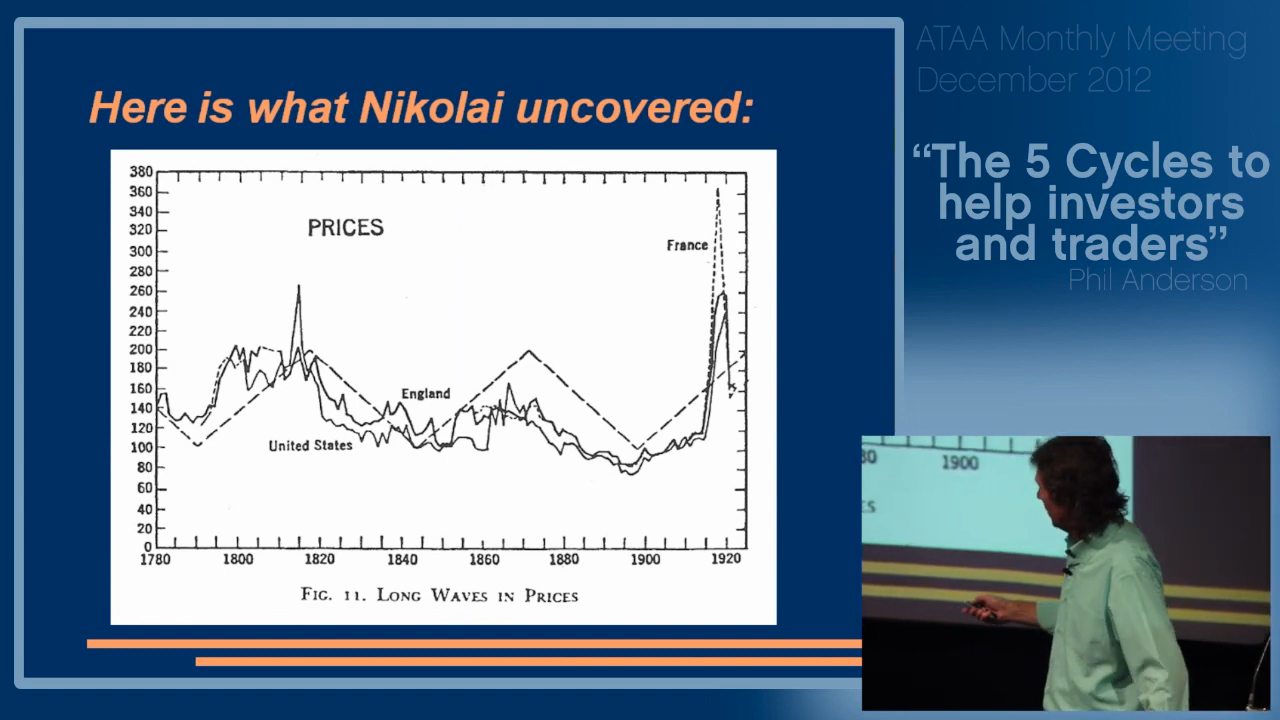 Commodity price cycles — Kondratieff wave overlaid with commodity price history.
Source: PSE Video
Commodity price cycles — Kondratieff wave overlaid with commodity price history.
Source: PSE Video
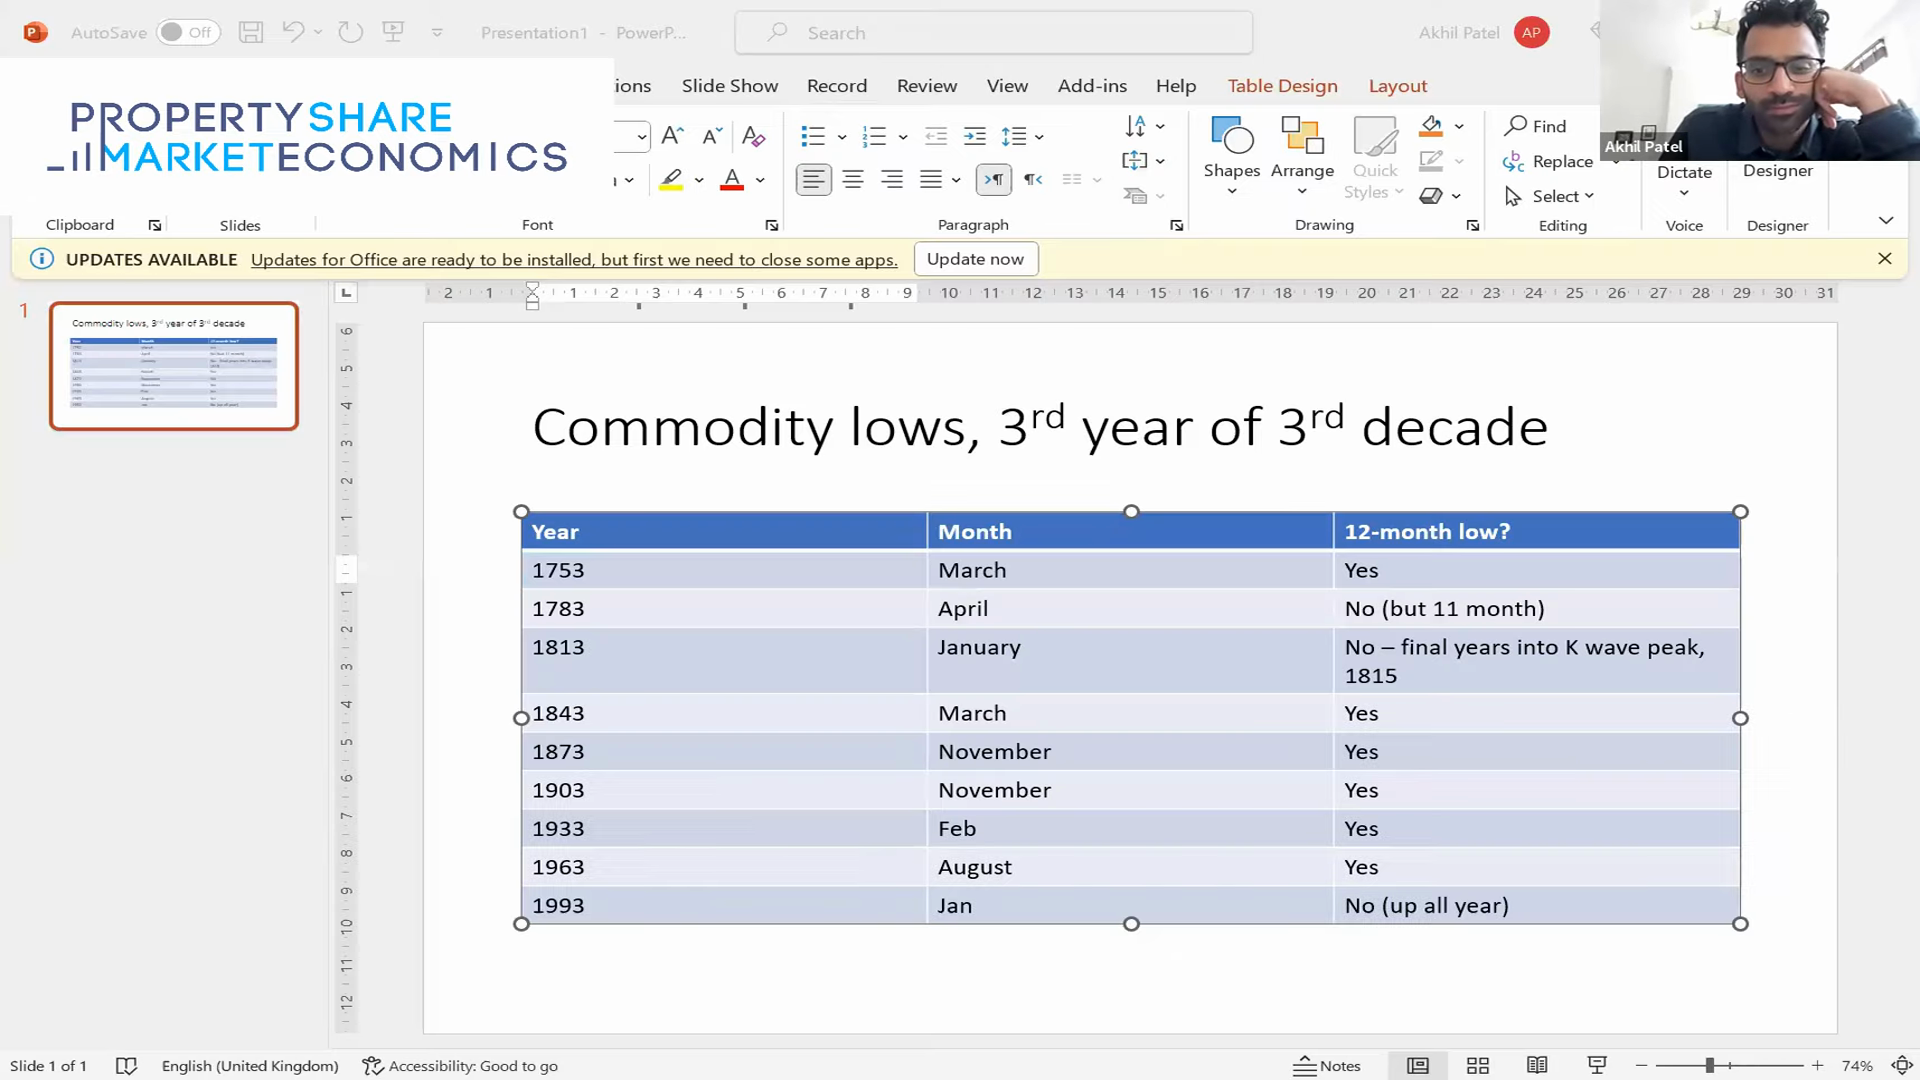 Commodity lows in 3rd years — table showing commodity cycle patterns by decade.
Source: PSE Video
Commodity lows in 3rd years — table showing commodity cycle patterns by decade.
Source: PSE Video
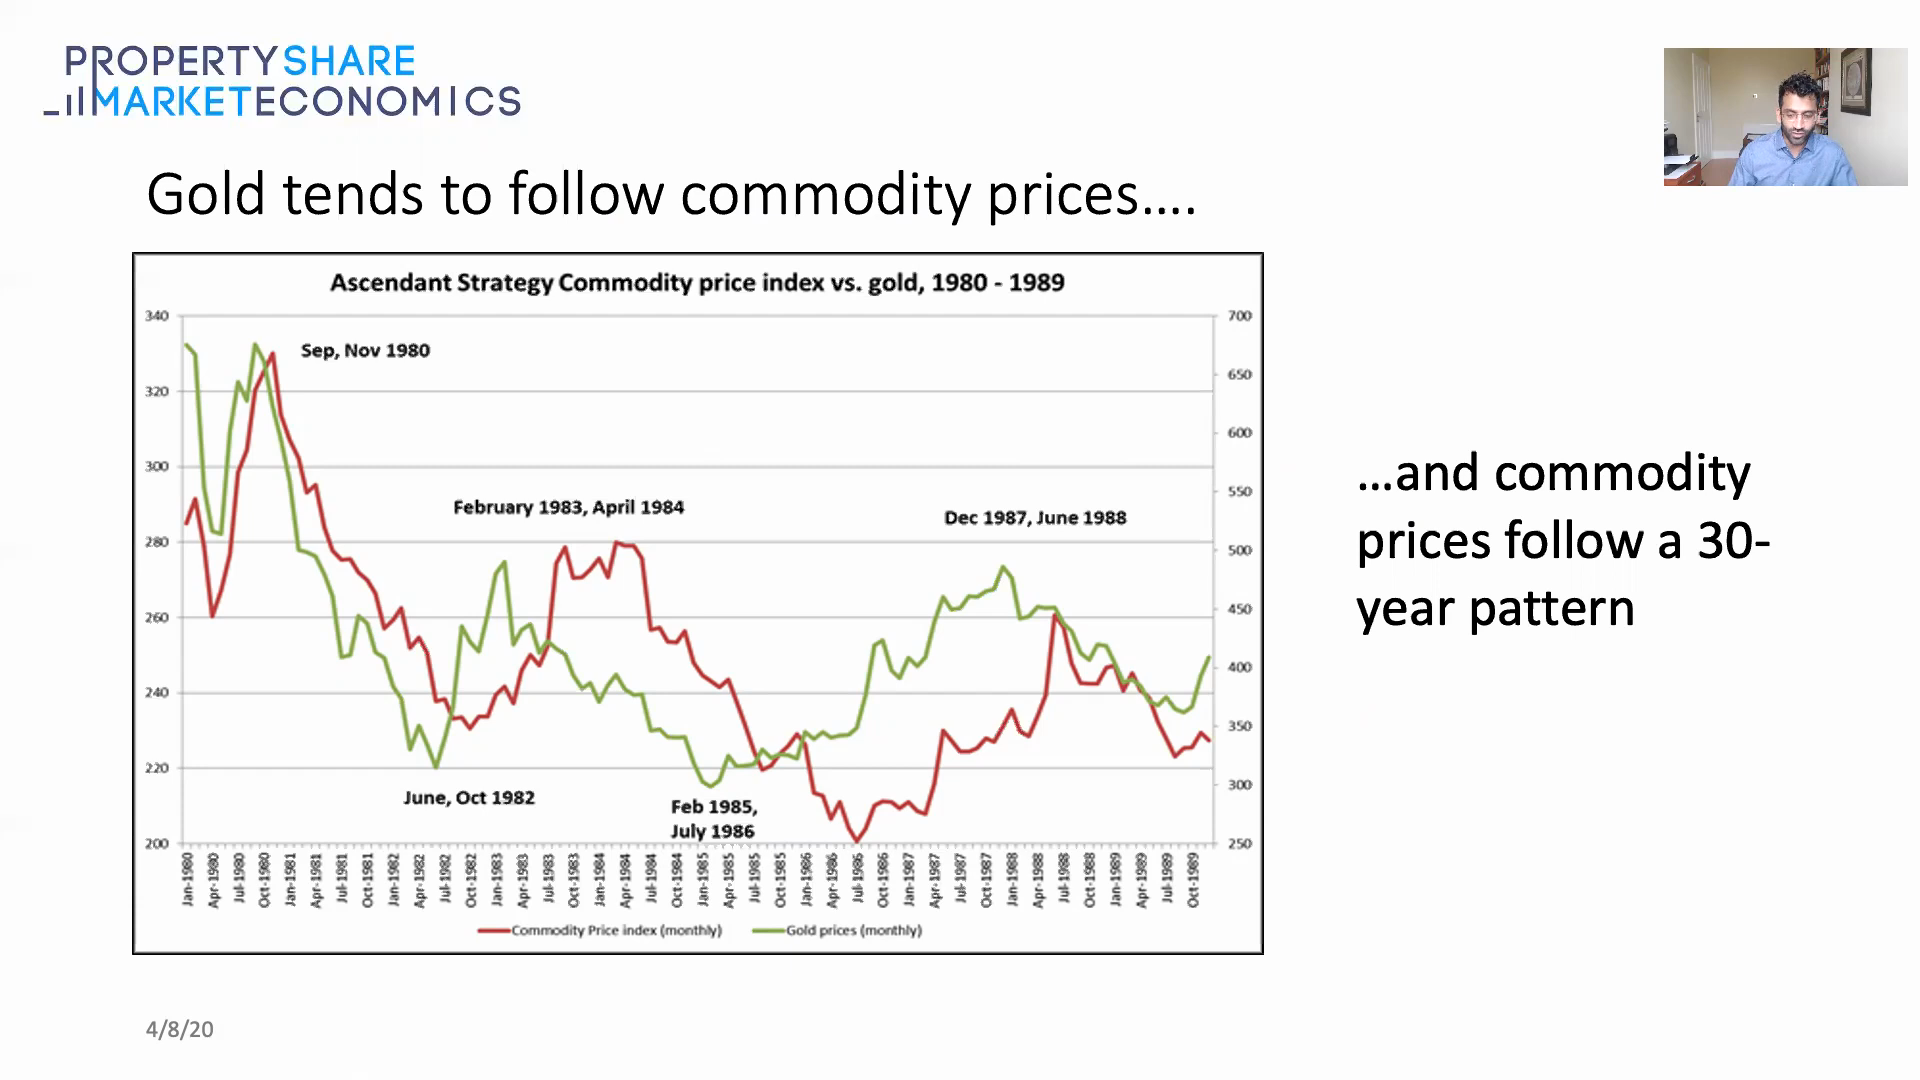 Commodity/Gold price index — long-term chart from historical series.
Source: PSE Video
Commodity/Gold price index — long-term chart from historical series.
Source: PSE Video
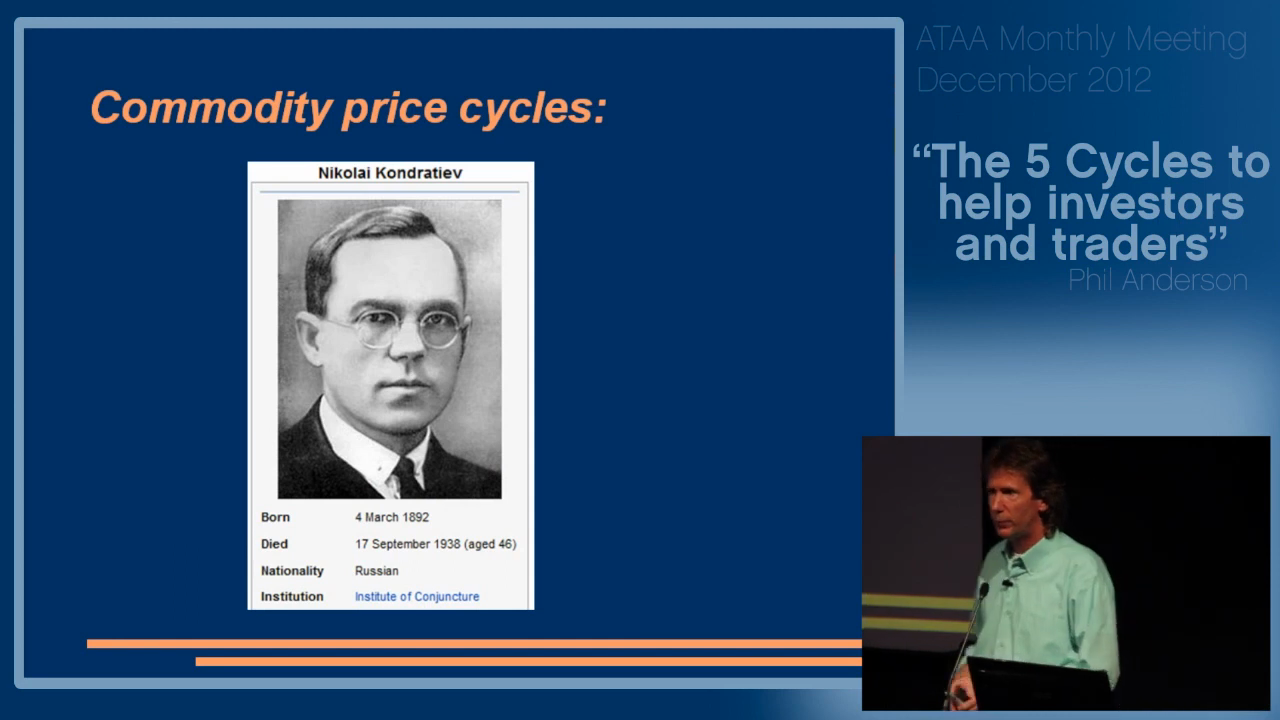 Nikolai Kondratiev and commodity prices — the K-wave and commodity supercycle connection.
Source: PSE Video
Nikolai Kondratiev and commodity prices — the K-wave and commodity supercycle connection.
Source: PSE Video
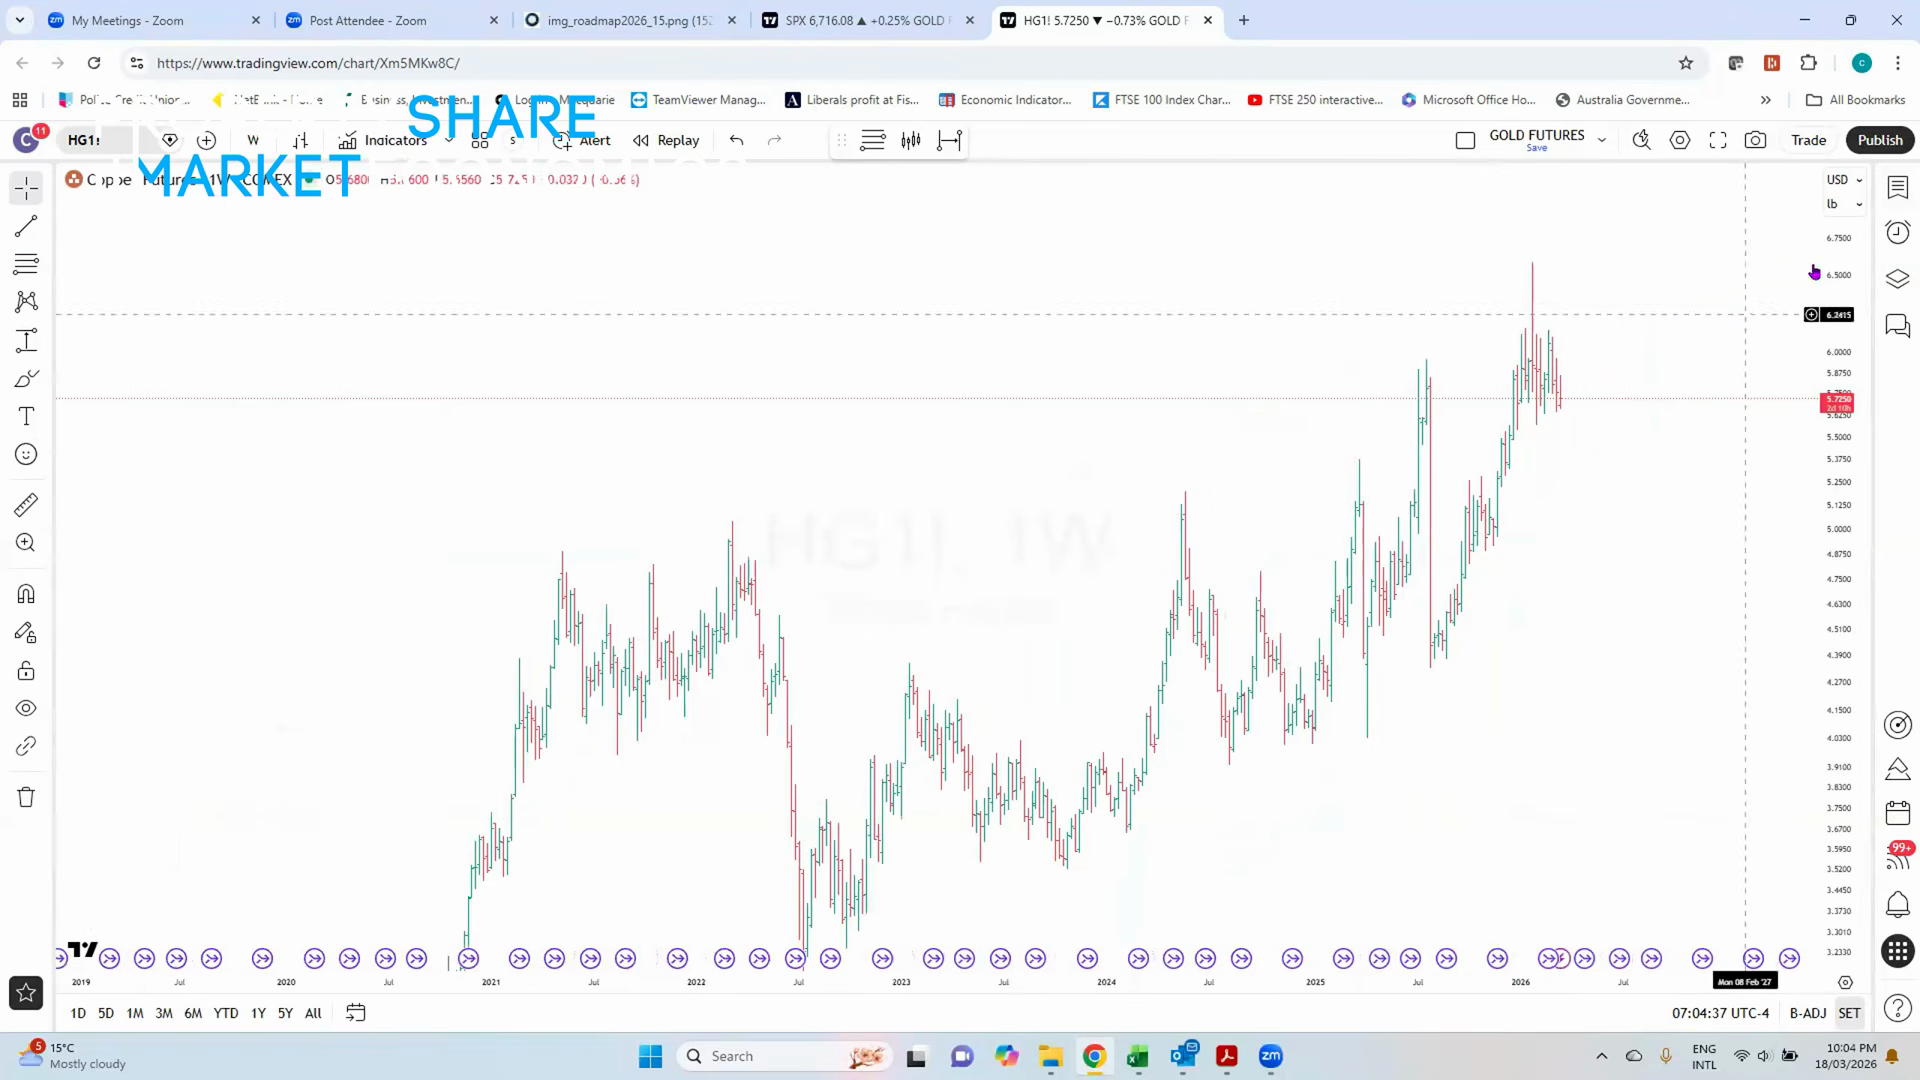 Copper futures price chart — industrial metal as commodity cycle indicator.
Source: PSE Video
Copper futures price chart — industrial metal as commodity cycle indicator.
Source: PSE Video
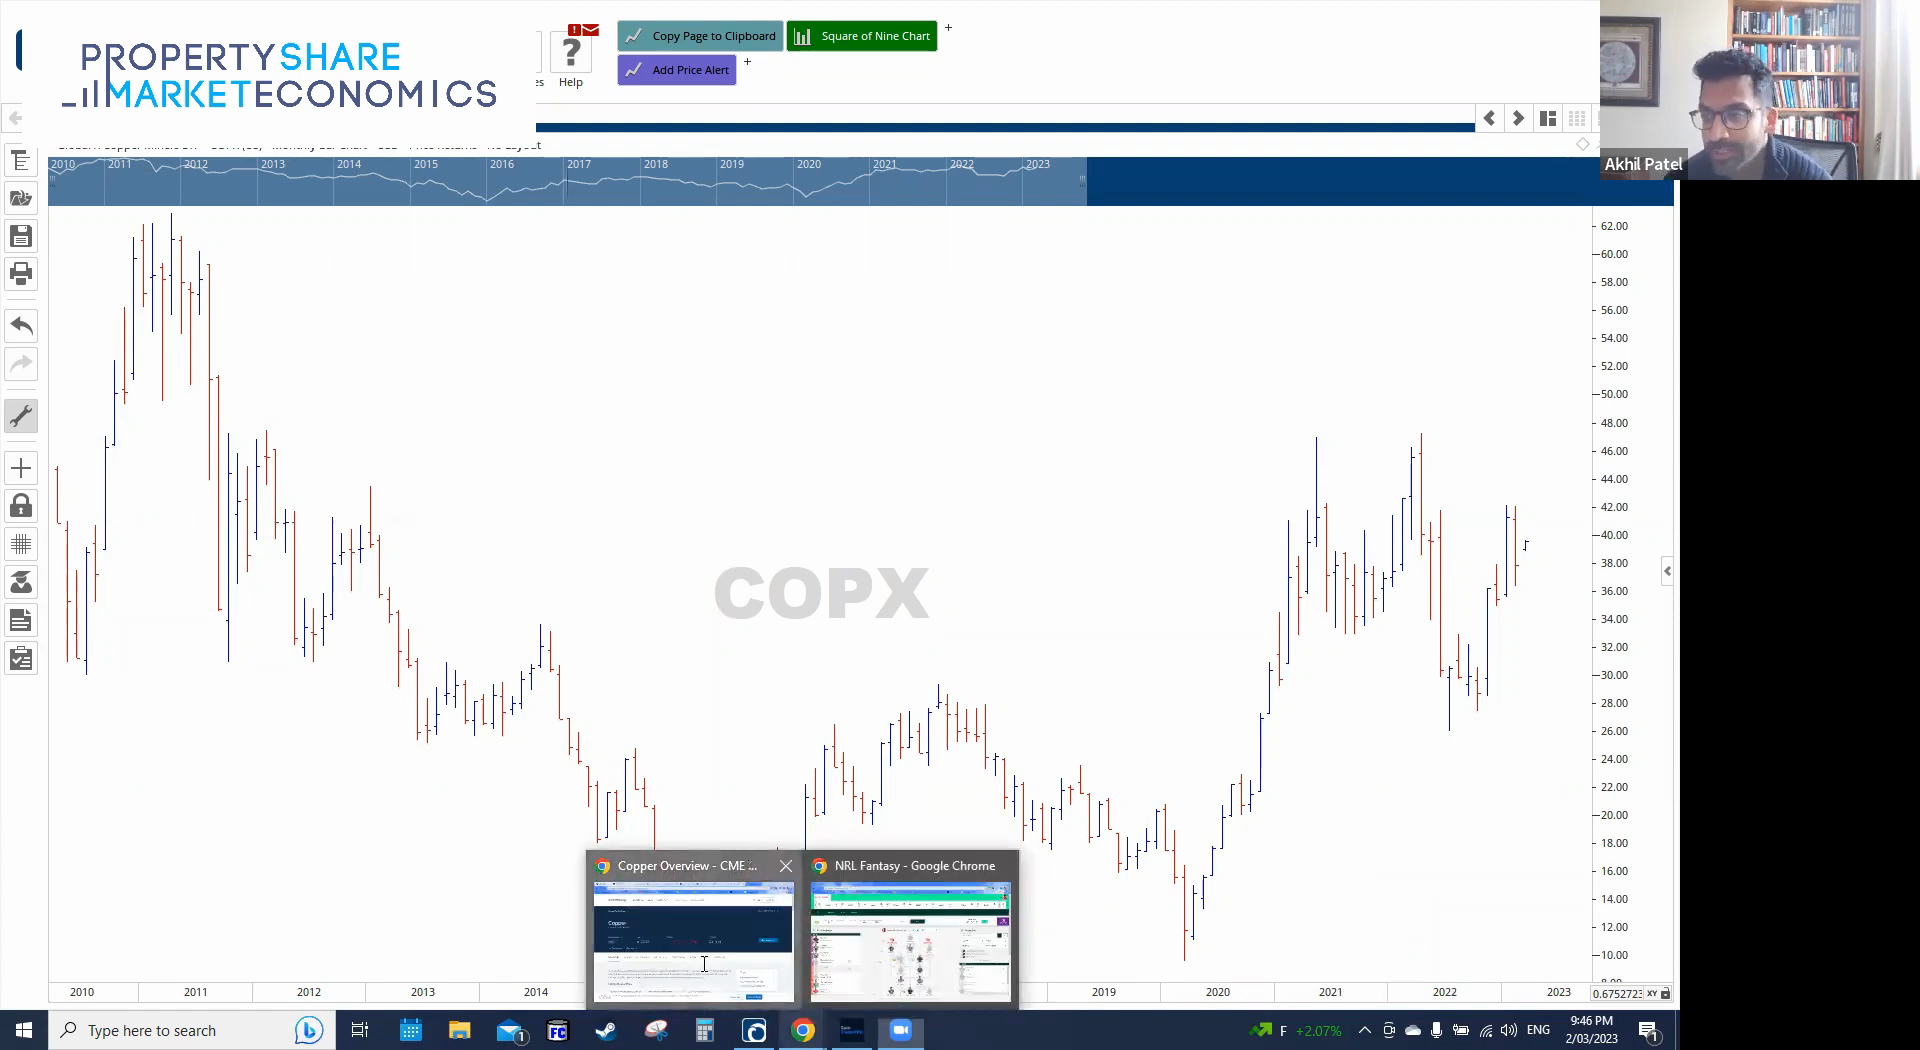 Copper futures analysis — PSE commentary on copper as a leading commodity indicator.
Source: 2023-02-02-bbi-february-2023
Copper futures analysis — PSE commentary on copper as a leading commodity indicator.
Source: 2023-02-02-bbi-february-2023
 Cotton futures — historical chart used in Gann/PSE commodity analysis.
Source: PSE Video
Cotton futures — historical chart used in Gann/PSE commodity analysis.
Source: PSE Video