Summary
The Kondratieff Wave (K-wave) is a long-term (~50–60 year) economic cycle identified by Russian economist Nikolai Kondratieff in the 1920s. It describes recurring patterns of expansion and contraction in capitalist economies, driven by technological innovation waves, capital investment cycles, and commodity price cycles. Phil Anderson and Akhil Patel reference the K-wave as a macro overlay on the 18.6-year real estate cycle — they are independent frameworks from different intellectual traditions, but PSE uses both in combination. The current K-wave is projected to peak around 2026–2027, coinciding with the 18.6-year real estate cycle top from the 2012 land-price lows. Their simultaneous peak could amplify the post-2026 downturn significantly beyond a typical 18.6-year cycle trough.
The K-Wave Framework (Kondratieff, 1920s)
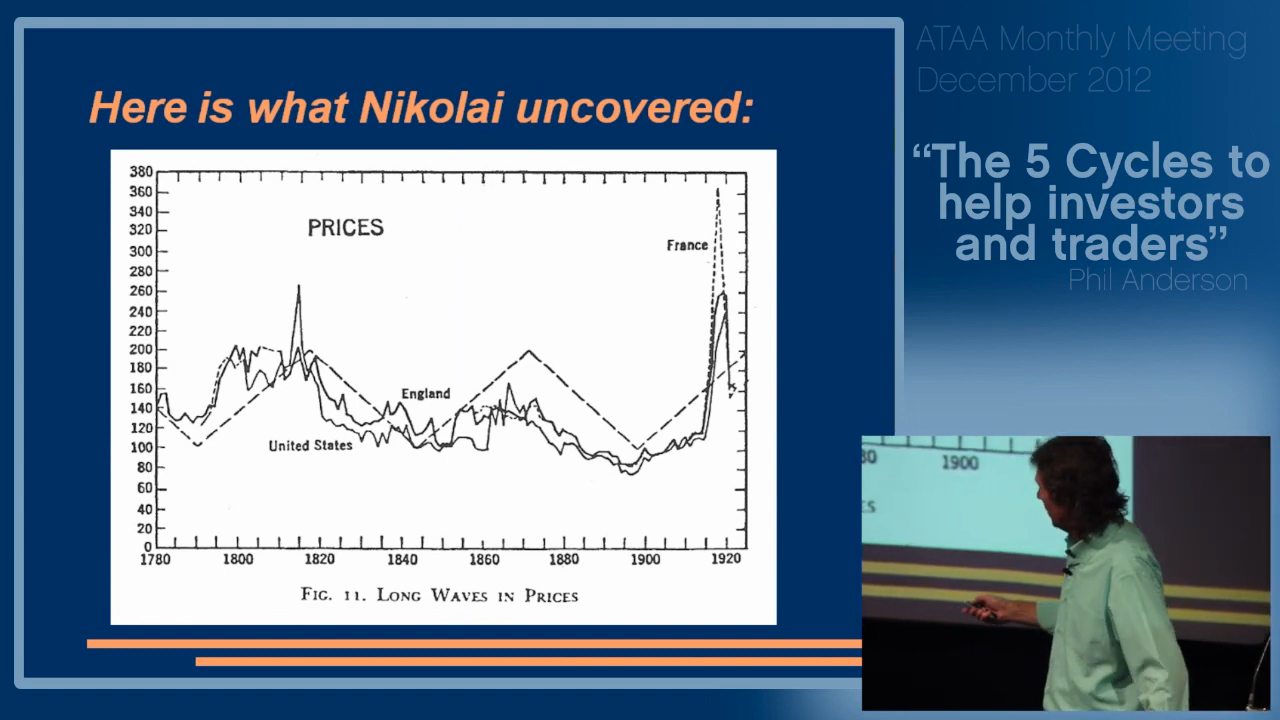
Nikolai Kondratieff, a Soviet economist, identified a long economic wave in commodity prices and output in his 1925 paper, based on data from England, France, and the USA going back to the late 18th century. Key characteristics:
- Duration: Approximately 50–60 years (some analysts argue 45–70 years)
- Phases: Typically described as Spring (expansion), Summer (plateau/inflation), Autumn (stagnation/speculation), Winter (contraction/debt deflation)
- Mechanism: Driven by major technological innovations that create new industries, reach maturity, then fade
- Historical peaks: ~1873, ~1929, ~1974, ~2026 (current cycle projection)
Kondratieff was later executed by Stalin (1938) for work that implied capitalism was cyclically self-renewing rather than doomed to collapse. His framework was subsequently developed by Joseph Schumpeter (who coined “creative destruction”) and is now used across heterodox and mainstream economics.
David Hackett Fischer’s The Great Wave (referenced by Phil Anderson) extends the framework: inflation comes in four great waves through Western history; 21st-century inflation trends lower with episodic surges — no repeat of 1970s 12–20% annual inflation. [Source: BBI April 29 2026]
PSE / Anderson-Patel Framework
- K-wave peaks coincide with real estate cycle peaks: At K-wave tops, the world’s major powers are “at loggerheads,” and there is always a risk of war [Source: BBI December 2021]
- The current K-wave is peaking around 2026–2027: Aligned with the 18.6-year real estate cycle peak from the 2012 land-price low
- Two cycles declining simultaneously (K-wave + 18.6-year) could amplify the post-2026 downturn
- K-wave winter characteristics: Debt deflation, currency crises, geopolitical conflict, social upheaval
Relationship to the 18.6-Year Cycle
- The K-wave operates at a ~3-cycle macro level (approximately 3 × 18.6 = ~56 years)
- At K-wave peaks, the 18.6-year real estate cycle peak is amplified
- K-wave winters historically correlate with major land price collapses (1873 Panic, 1929 Great Depression, 1974–1982 stagflation, potentially post-2026)
- Both cycles are independent frameworks — Kondratieff developed the K-wave without reference to the 18-year land cycle. Their alignment at ~2026 is a convergence of separate analytical traditions.
Key Evidence (from BBI sessions)
- Phil (June 2023): “The K-wave would be peaking. And we know at the top of each K-wave the world’s powers have been at loggerheads, and there’s always a chance of war coming.” [Source: BBI June 2023]
- September 2023: “We’re coming into the peak of the K-wave in 2027 if that’s still on track and then down after that” [Source: BBI September 2023]
- Akhil: K-wave as context for why the post-2026 downturn could be more severe than a normal 18.6-year cycle trough [Source: BBI December 2023]
- Australia: BBI discussion noted the Brisbane 2032 Olympics and other infrastructure could cushion Australian K-wave effects [Source: BBI December 2023]
April 2026 BBI — Masking Effect Thesis
Phil Anderson, BBI Q&A April 29, 2026:
- K-Wave commodity peaks: 1919 (wheat; Gann charts confirm; wheat = war proxy), 1974, ~2026 (commodities peaking now). [Source: BBI April 29 2026]
- Post-peak dynamics: “prodigious gains” typically follow K-wave top for ~10 years (1919→1929, 1974→1984 roughly). [Source: BBI April 29 2026]
- Key 2026 framing: The K-wave’s continued high-commodity plateau will “mask” the typical land-cycle collapse. US land prices are expected to decline post-2026, but “not like the early 1980s” — because land prices have already absorbed all the gains from 30+ years of falling rates. If rates reached 8–11%, today’s land price levels would be completely unaffordable. [Source: BBI April 29 2026]
- Akhil’s addition: On the downside of a real estate cycle AND the downside of the K-wave simultaneously → underlying deflationary forces. But inflation will still occur in some targeted areas (technology sectors, not general monetary printing). [Source: BBI April 29 2026]
Contradictions & Open Questions
- The K-wave timing is contested among analysts: some place the current peak earlier (2018–2022), others later (2030+)
- The “masking effect” thesis (K-wave commodity plateau softening land-price collapse) is Phil’s interpretation — not a claim from Kondratieff’s original work
- Whether K-wave “Autumn” and “Winter” phases map cleanly onto the PSE 18.6-year framework needs more explicit documentation
- Australia’s cushioning factors (Brisbane 2032 Olympics) suggest geographic variation in K-wave impact
Key Sources
- 2021-12-01-bbi-december-2021 — first mention of post-2026 K-wave implications
- 2022-07-01-bbi-july-2022 — crypto as K-wave/currency crisis hedge
- 2023-09-07-bbi-september-2023 — K-wave peak and Nasdaq secular cycles
- 2023-12-21-bbi-december-2023 — “two cycles coming down” for Australia
- 2026-01-22-bbi-january-2026 — K-wave + 18.6-year + North Node Aquarius convergence
- 2026-04-29-bbi-april-2026-qa — K-wave commodity peaks 1919/1974/2026; masking effect on land price collapse; David Hackett Fischer’s Great Wave
Related Concepts
- 18.6-Year Real Estate Cycle — the shorter cycle K-wave amplifies
- Gold — K-wave commodity peak dynamics
- Liquidity Cycle — K-wave winter = deflationary deleveraging
- Financial Timetable — decade-cycle overlays operate within the K-wave context
 K-Wave Decoded — PSE’s dedicated eBook unpacking the Kondratieff long-wave cycle.
Source: PSE Subscriber Resource
K-Wave Decoded — PSE’s dedicated eBook unpacking the Kondratieff long-wave cycle.
Source: PSE Subscriber Resource
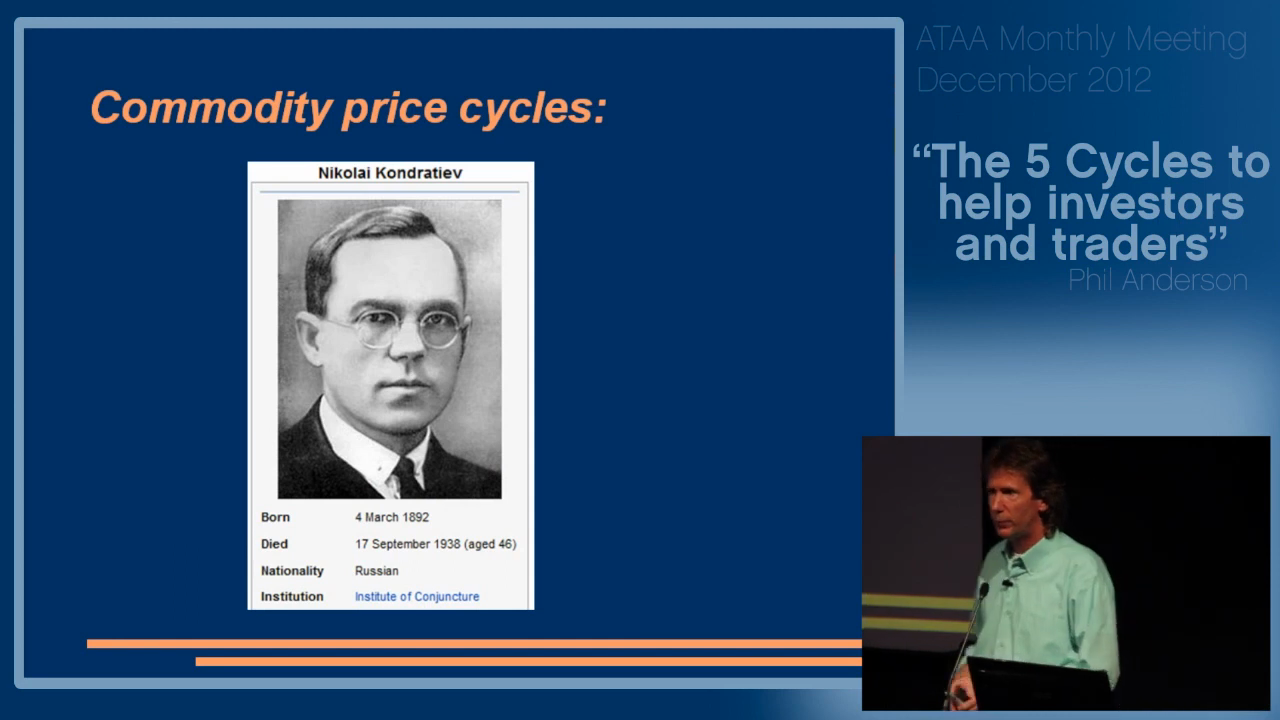 Nikolai Kondratiev and commodity prices — context slide on the originator.
Source: PSE Video
Nikolai Kondratiev and commodity prices — context slide on the originator.
Source: PSE Video
More Charts
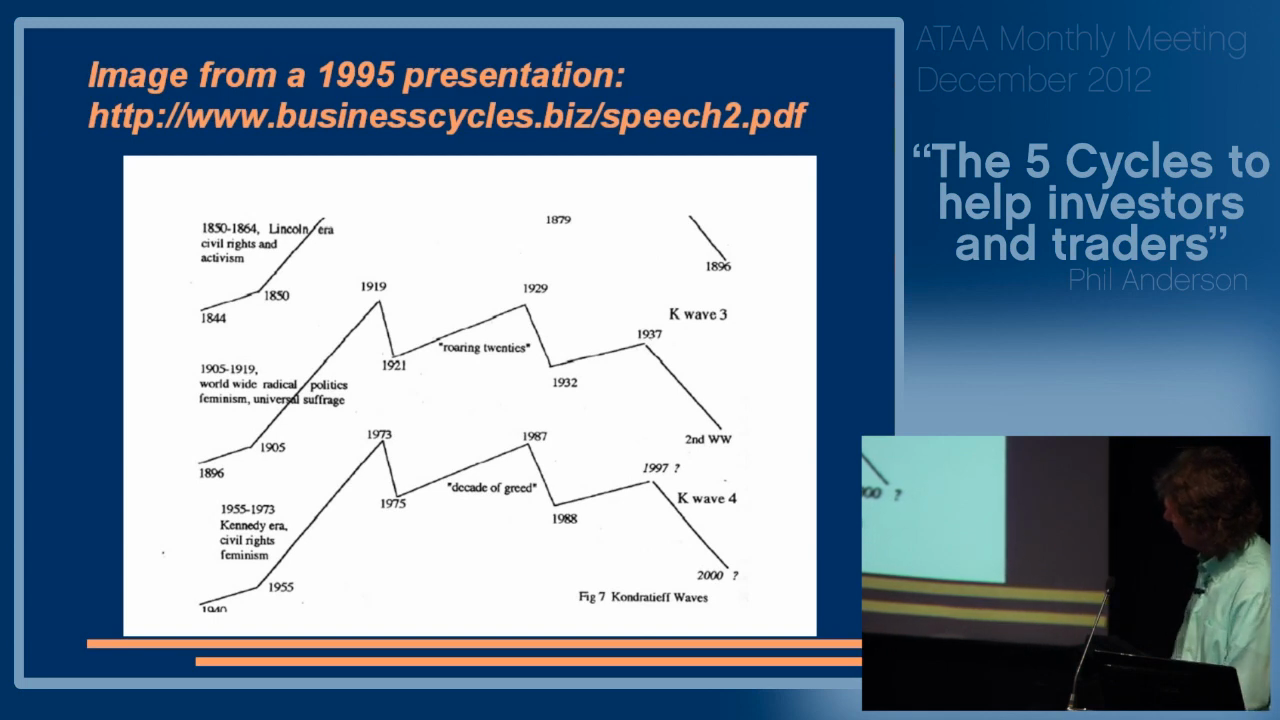
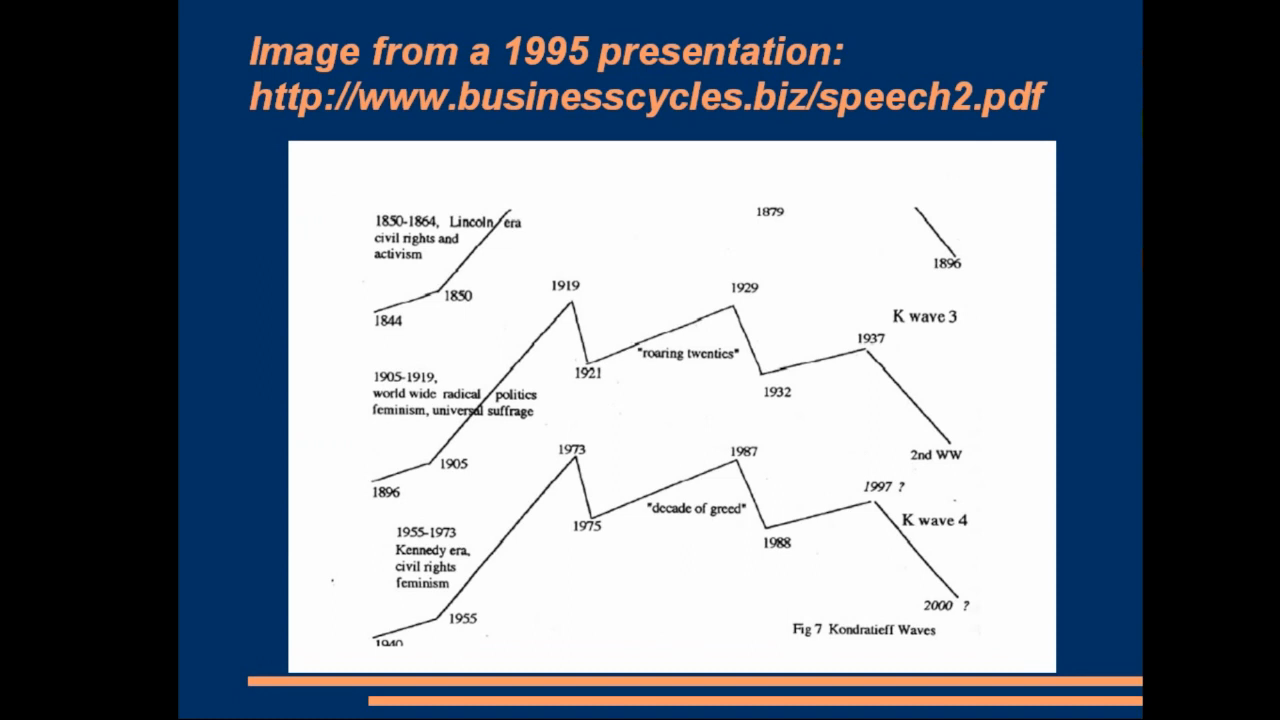
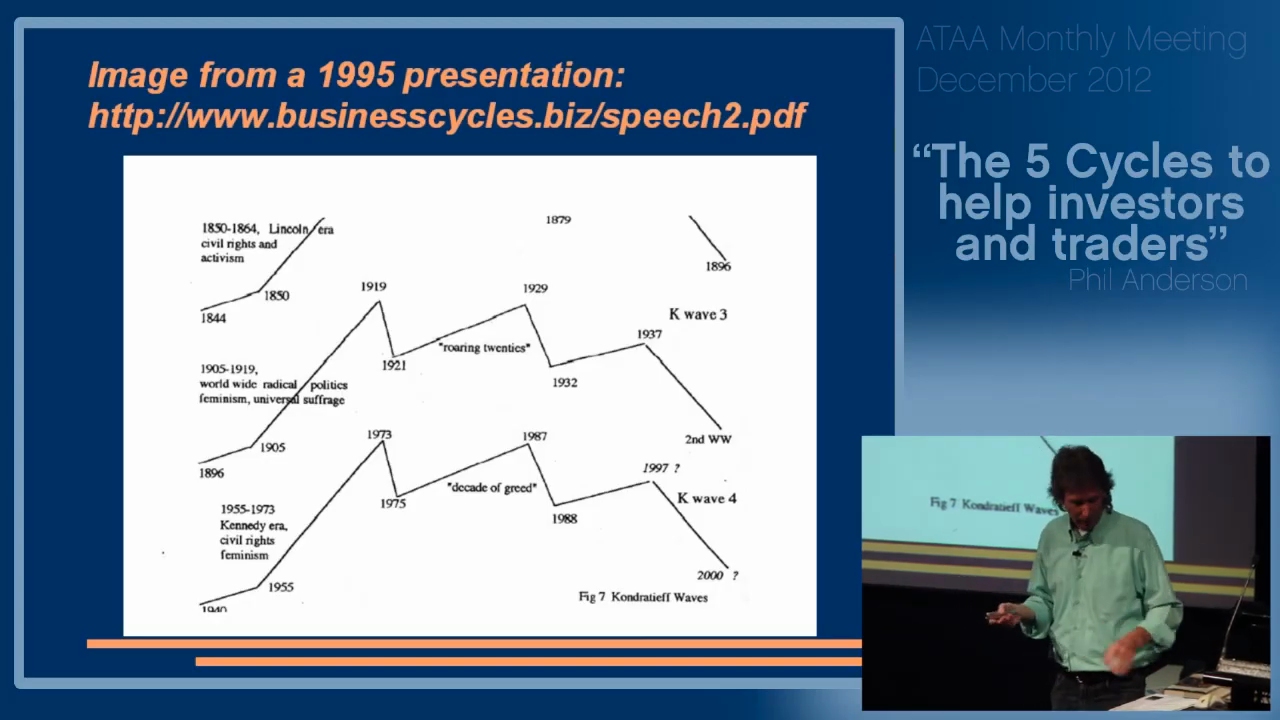 Kondratieff waves explained — slide with presenter commentary.
Source: PSE Video
Kondratieff waves explained — slide with presenter commentary.
Source: PSE Video
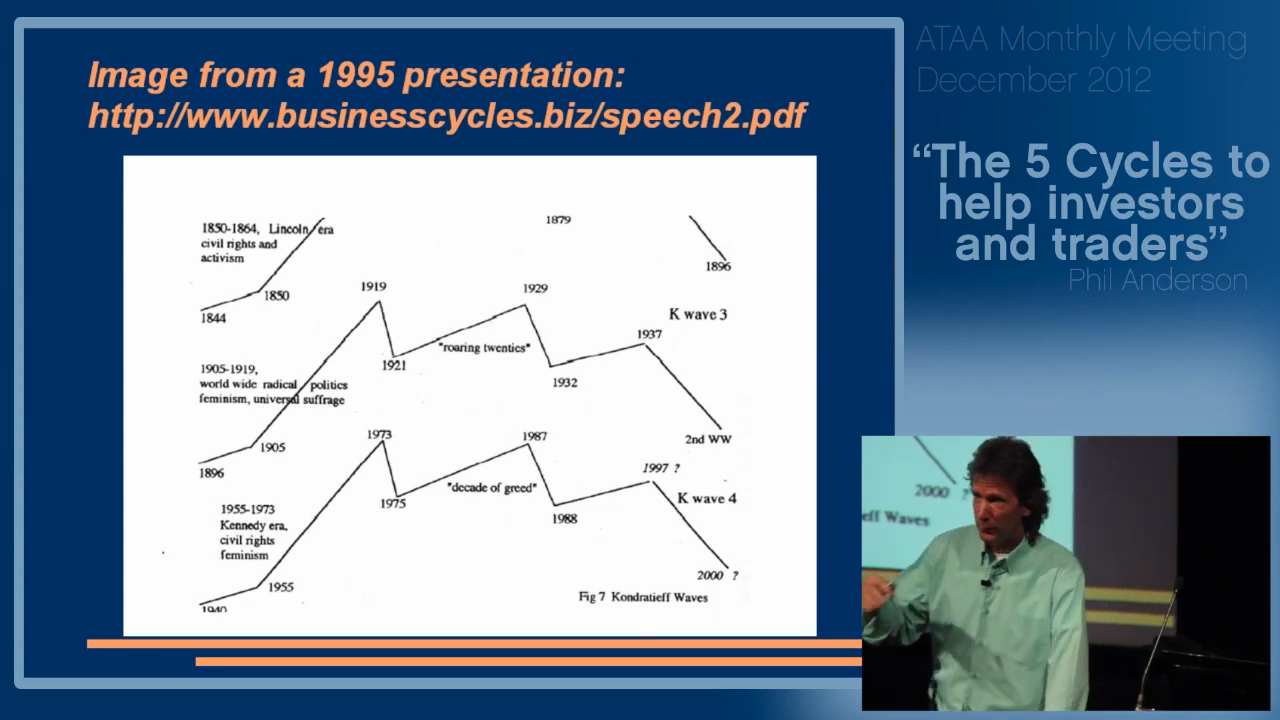 Kondratiev wave graph — speaker presenting the long-wave economic framework.
Source: PSE Video
Kondratiev wave graph — speaker presenting the long-wave economic framework.
Source: PSE Video
 Kondratieff wave graph — visual representation of the commodity/price cycle.
Source: PSE Video
Kondratieff wave graph — visual representation of the commodity/price cycle.
Source: PSE Video
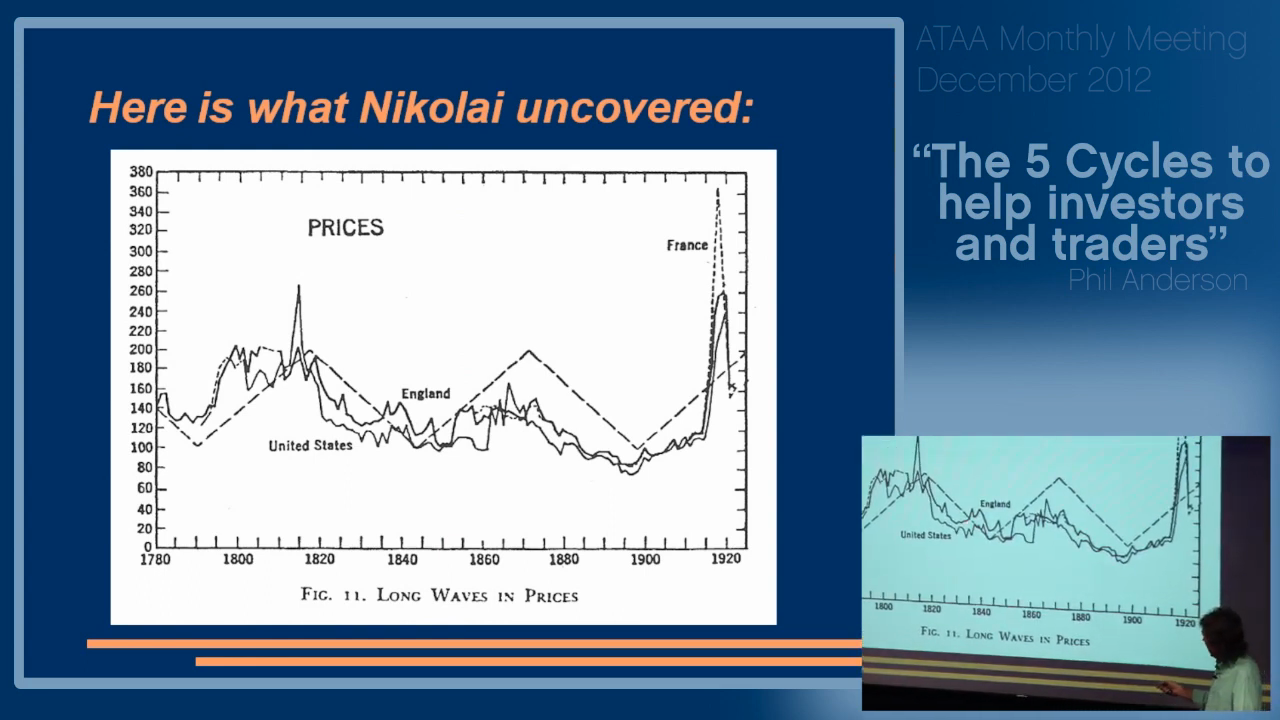 Long waves in prices (England) — historical price series illustrating K-wave cycles.
Source: PSE Video
Long waves in prices (England) — historical price series illustrating K-wave cycles.
Source: PSE Video
 Speaker presentation — graph of Kondratieff waves with economic commentary.
Source: PSE Video
Speaker presentation — graph of Kondratieff waves with economic commentary.
Source: PSE Video
 Commodity price cycles — Kondratieff cycle mapped against commodity prices.
Source: PSE Video
Commodity price cycles — Kondratieff cycle mapped against commodity prices.
Source: PSE Video