Summary
W.D. Gann developed a system of time counts - specific calendar dates derived from planetary positions, seasonal turning points, and degree-based counting - that identify when markets are likely to change trend. PSE, led by Phil Anderson, applies “Gann dates” (monthly pressure points), seasonal dates (solstices/equinoxes and their midpoints), and degree-counting (30°, 60°, 90°, 150°, 240° counts from key market highs/lows). Gann’s original framework was developed in the early 20th century independently of the 18.6-year land cycle tradition; PSE synthesizes both. The system also applies to individual lives - tracking emotional peaks in famous people’s biographies.
Core Claims
- 2026-01-09-gann-dates-2026 (2026-01-09): Gann’s 1929 forecast (November 1928) correctly predicted March low, August/September high, and that leading stocks would top first. - confidence: high
- 2026-01-09-gann-dates-2026 (2026-01-09): Gann used 20-year (1909) and 60-year (1869) repeats to construct the 1929 forecast. - confidence: high
- 2026-01-09-gann-dates-2026 (2026-01-09): 2026 seasonal dates: March 21, June 22, September 23, December 22; mid-points February 2/3, May 4, August 6, November 6. - confidence: high
- 2026-01-14-small-cycles-large-cycles (2026-01-14): Iranian hostages held exactly 420 days (60 weeks) - Gann time count applied to geopolitical events. - confidence: high
- 2026-03-26-notes-and-items (2026-03-26): March 27 = 150° from Oct 29 2025 top, 60° from 2026 top, 30° from Feb 28 war start. - confidence: high
- 2026-03-26-notes-and-items (2026-03-26): Feb 28 (Iran war start) is 240° in days from US mid-terms, split by July 4. - confidence: high
- 2026-01-19-eclipse-seasonal-reminders (2026-01-19): Feb 17 solar eclipse → count 30, 60, 90 days; especially 60 days = April. - confidence: high
- pse-sub-email-gann-06-for-2026-7-roadmap-current-market-16-april-2026 (2026-04-16): Late April is 30 months from Oct 2023 low, and 180 days from Oct 2023 Nasdaq 100/AI stock peak. - confidence: high
- 2026-04-28-pse-market-update-gann-08 (2026-04-28): May 4 is a seasonal midpoint date between the spring equinox (Mar 21) and summer solstice (Jun 22); Phil Anderson flags this as a key Gann date aligned with the Roadmap’s change-in-trend signal. - confidence: high [Source: PSE Gann #08, 2026-04-28]
- BBI Q&A April 29 2026 (2026-04-29): Phil Anderson confirms the 30-month count from October 2023 low → April 2026 as a key inflection; projects the next 30 months (2½ years) pointing to October 2028 for the full unwind. PSE identifies NASDAQ recent top as 4,320 trading days from the March 2009 low (Gann square/count). Also noted: 7,200 calendar days from Gold’s May 2006 top = January 2026 top (72 × 100); and 64-week sideways gold pattern (64 = 8²). — confidence: high [Source: BBI April 29 2026, 2026-04-29]
- 2026-05-18-pse-sub-email-gann-11-set-up-examples (2026-05-18): Mining stocks specifically tend to see changes of trend around the 12th and 28/29 of some months, in addition to the standard monthly Gann dates (4th, 15th, 21/22). Solstice and equinox dates remain useful for all stocks. — confidence: high [Source: PSE Gann #11, 2026-05-18]
Mechanism / How It Works
- Seasonal dates: equinoxes and solstices (and their midpoints) are the year’s primary turning-point windows ±1-2 days
- Monthly “Gann dates”: planetary-angle pressure days each month - transport delays, personal decisions forced, market direction changes. Primary monthly dates: approximately the 4th, 15th, and 21/22 of each month. Solstice and equinox dates remain the most significant across all instruments.
- Mining stock date refinement: Mining stocks (ASX and US-listed resource companies) specifically tend to see changes of trend around the 12th and 28/29 of some months, in addition to the standard monthly Gann dates. Anderson flagged this as a sector-specific pattern in Gann #11 (May 2026). [Source: PSE Gann #11, 2026-05-18]
- Degree counting: count forward in degrees (treating 1 day = 1 degree): 30°, 60°, 90°, 120°, 150°, 180°, 240°, 270°, 360° from key highs/lows
- Year repeat cycles: 20-year, 60-year, 90-year repeats used to forecast year shape (e.g., 2026 ≈ 2006 and 1966 patterns)
- Personal cycles: 30-year, 45-year, 60-year counts applied to key people’s life events (marriage, power, death)
Key Evidence
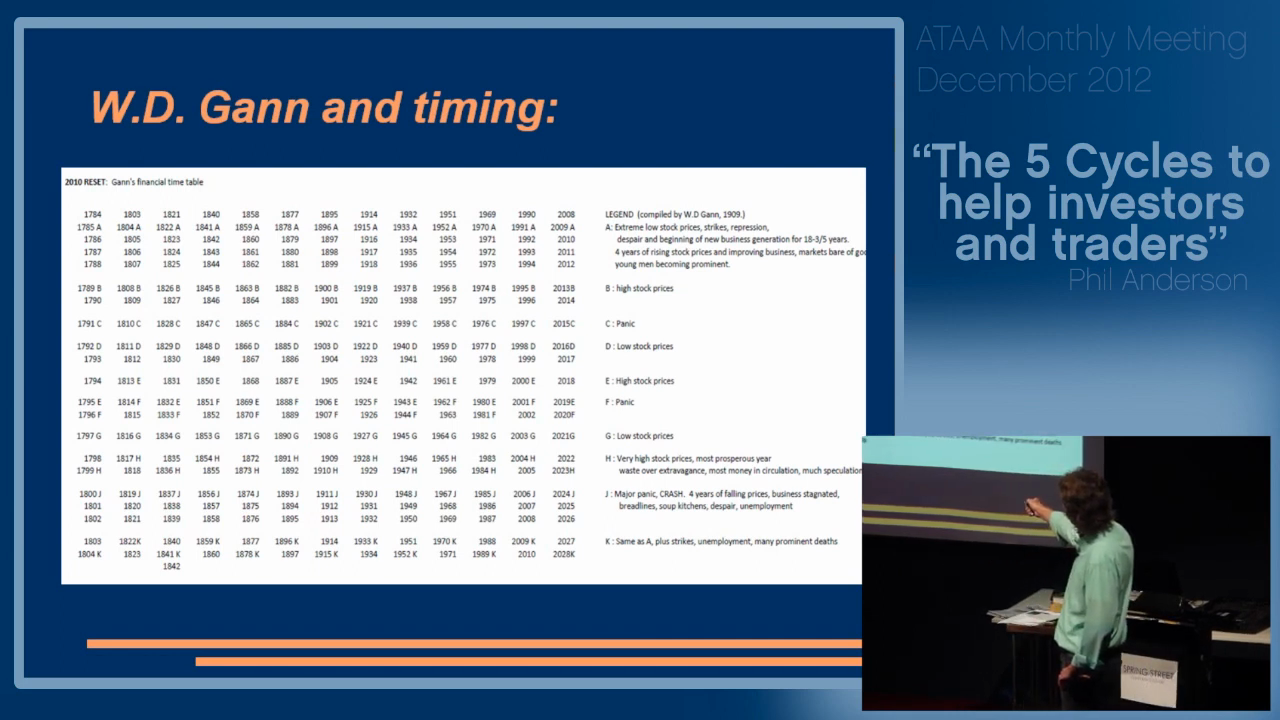
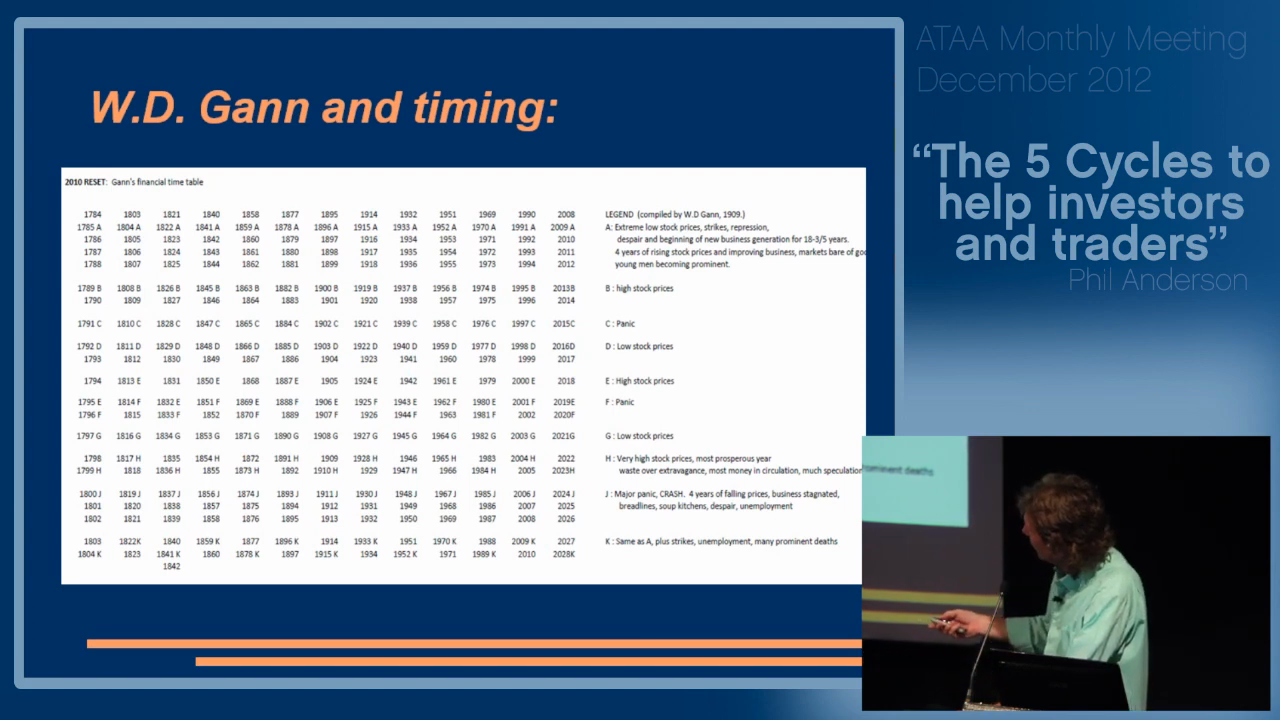 Gann Financial Timetable - chart with years and seasonal turning-point markers.
Source: PSE Video
Gann Financial Timetable - chart with years and seasonal turning-point markers.
Source: PSE Video
WD Gann’s cyclical framework - informational slide on Gann’s timing methodology.
Source: PSE Video
- Saturn at 24-28° Pisces (April 2025): predicted in 2025 email #8, produced volatility exactly as forecast
- Feb 17, 2026 solar eclipse at 28° Aquarius with Saturn/Neptune at 0° Aries - key timing marker for April
- Gann’s 1929 forecast: 4+ years in advance predicted October 3, 1931 bear market low in Tunnel Thru the Air (1927)
- Great Chicago fire October 8-10, 1871; Gann gold panic September 23-24, 1869 - cycle confirmation data points
Applications
- Put Gann dates in phone/calendar; observe headlines ±12 hours; do opposite of emotional headline
- “On these days, transport is more likely to run late, city traffic heavier, decisions forced”
- Count 30/60/90 days from key market turns and news events
- Watch PSE seasonal dates for primary trend changes
Evolution Over Time
- Gann dates evolved from PSE research applied over many years of observation
- Saturn/Neptune/Jupiter planetary rules for commodity markets (cotton, etc.) are a separate sub-application
- Phil Anderson integrates personal cycle counting into Gann Class content
- June 2026: Late-June solstice (Jun 22) flagged as an actionable weakness window per PSE forecast curves. Anderson notes this as aligned with another period of weakness, making short setups on stocks bouncing weakly off key support levels the current focus. [Source: PSE Gann #16, 2026-06-09]
Contradictions & Open Questions
- Planetary/esoteric basis is not provable via conventional finance theory - requires empirical observation
- Phil notes: “if the day falls on a weekend… not always” - some imprecision acknowledged
- How Gann’s original system (early 20th century equity markets) translates to 21st-century global markets is not fully documented
Related Concepts
More Charts
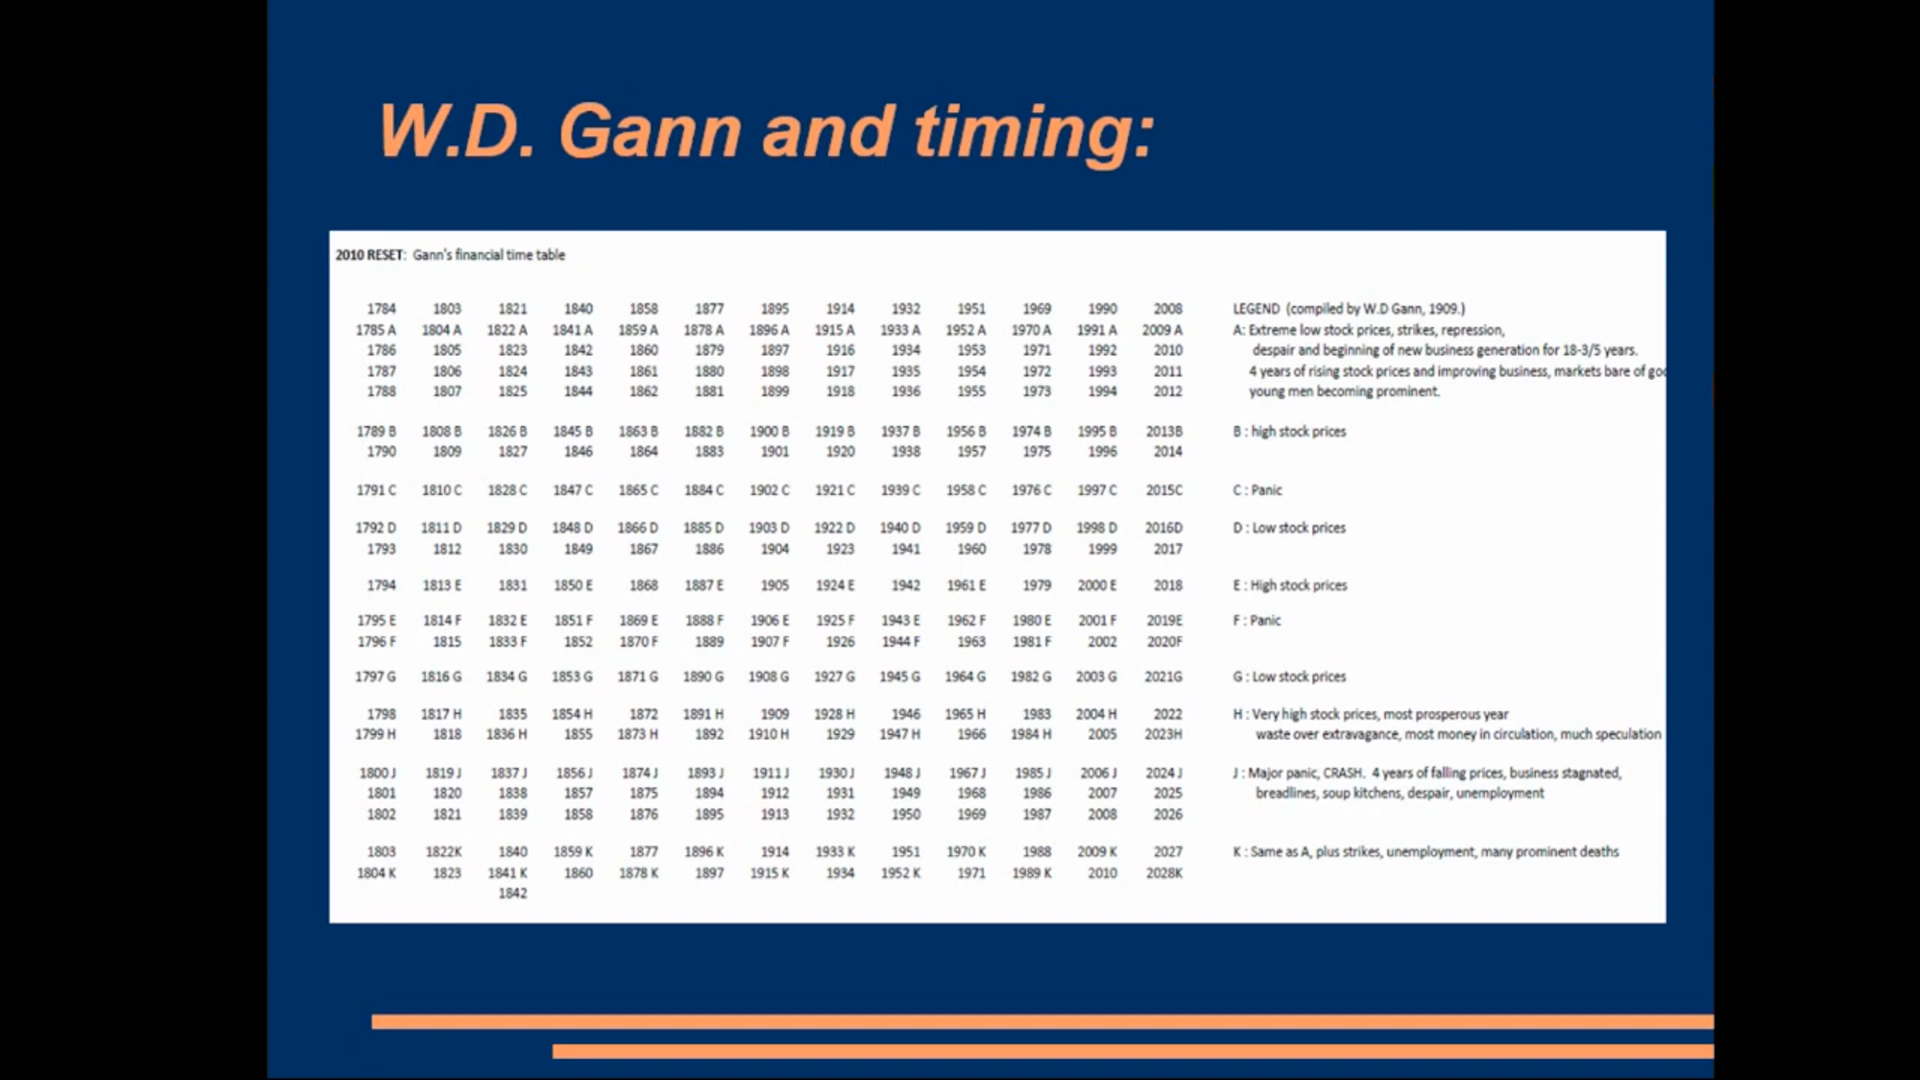 Table of Gann’s Financial Time - correlating cycle dates with market events.
Source: PSE Video
Table of Gann’s Financial Time - correlating cycle dates with market events.
Source: PSE Video
 WD Gann’s financial insights - slide detailing Gann’s analytical framework.
Source: PSE Video
WD Gann’s financial insights - slide detailing Gann’s analytical framework.
Source: PSE Video
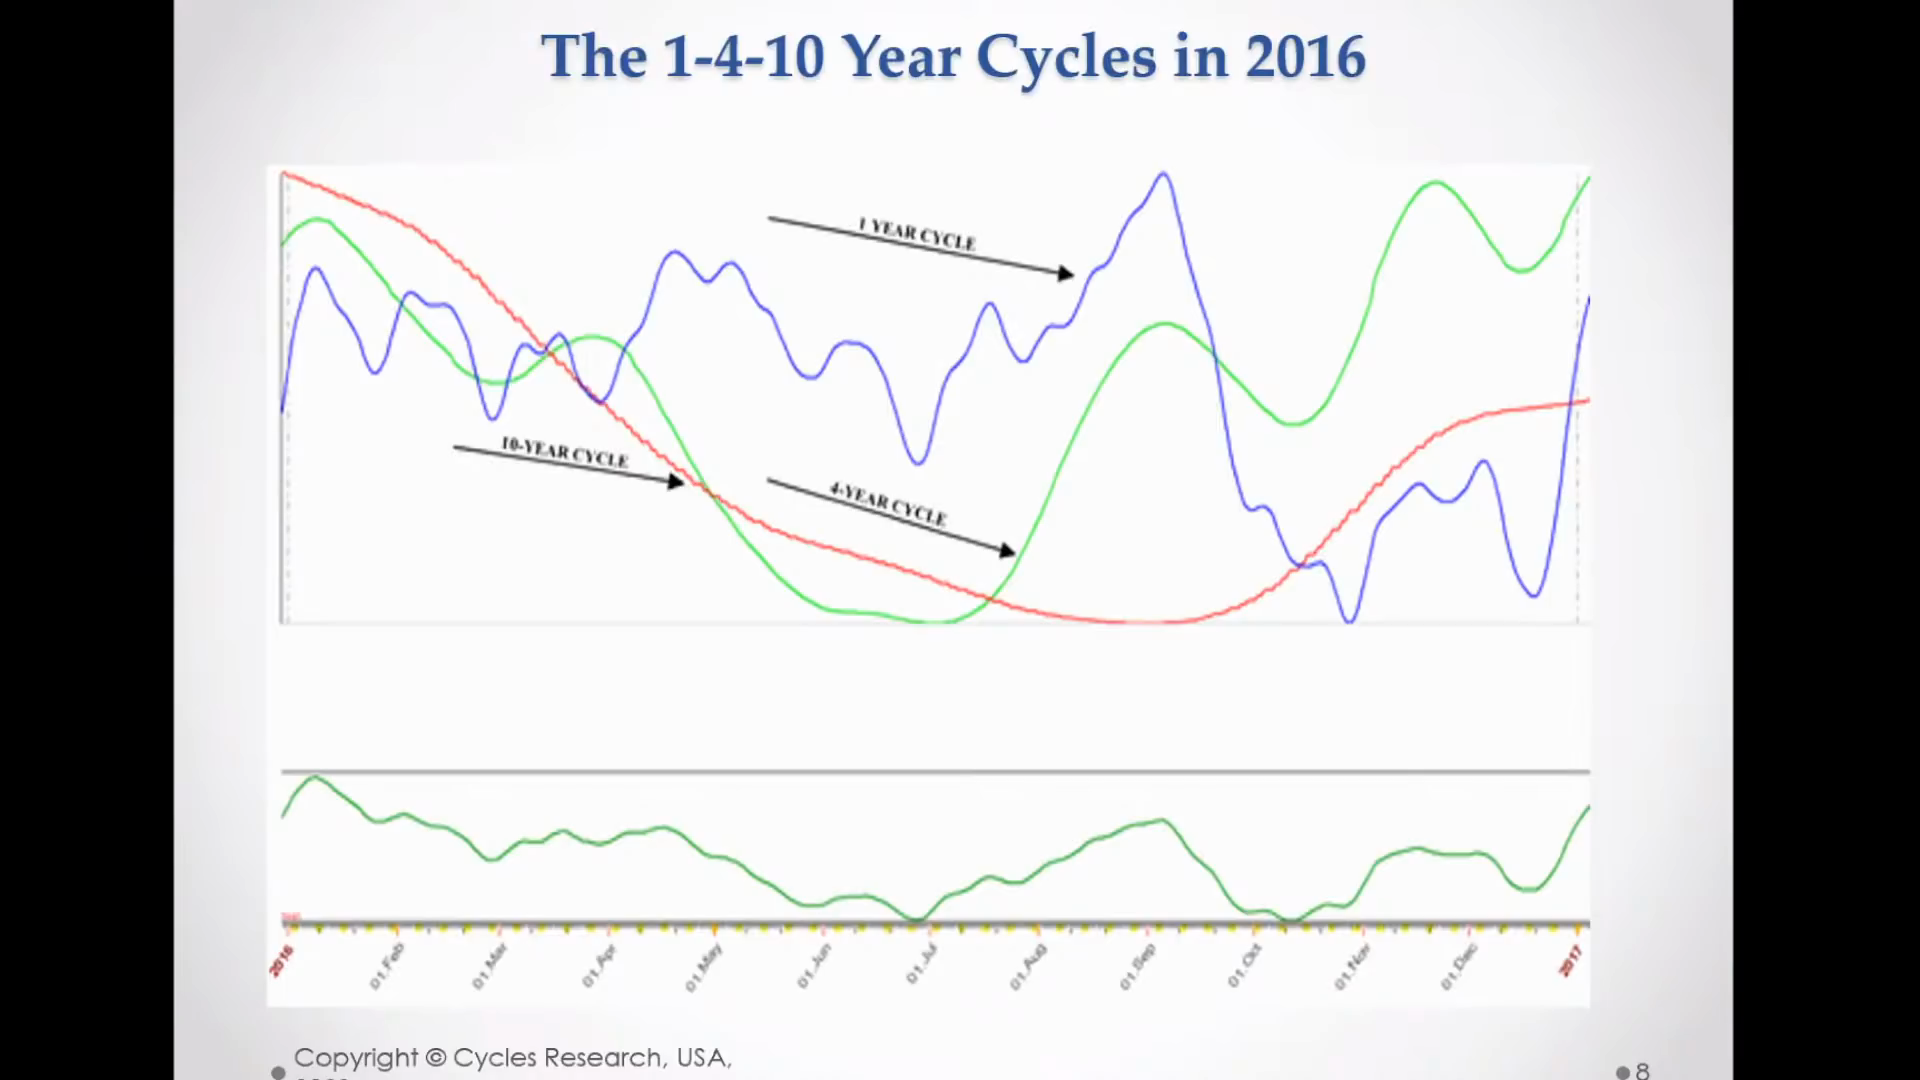 1, 4, and 10-year cycles - short and medium cycle overlays used in timing analysis.
Source: PSE Video
1, 4, and 10-year cycles - short and medium cycle overlays used in timing analysis.
Source: PSE Video
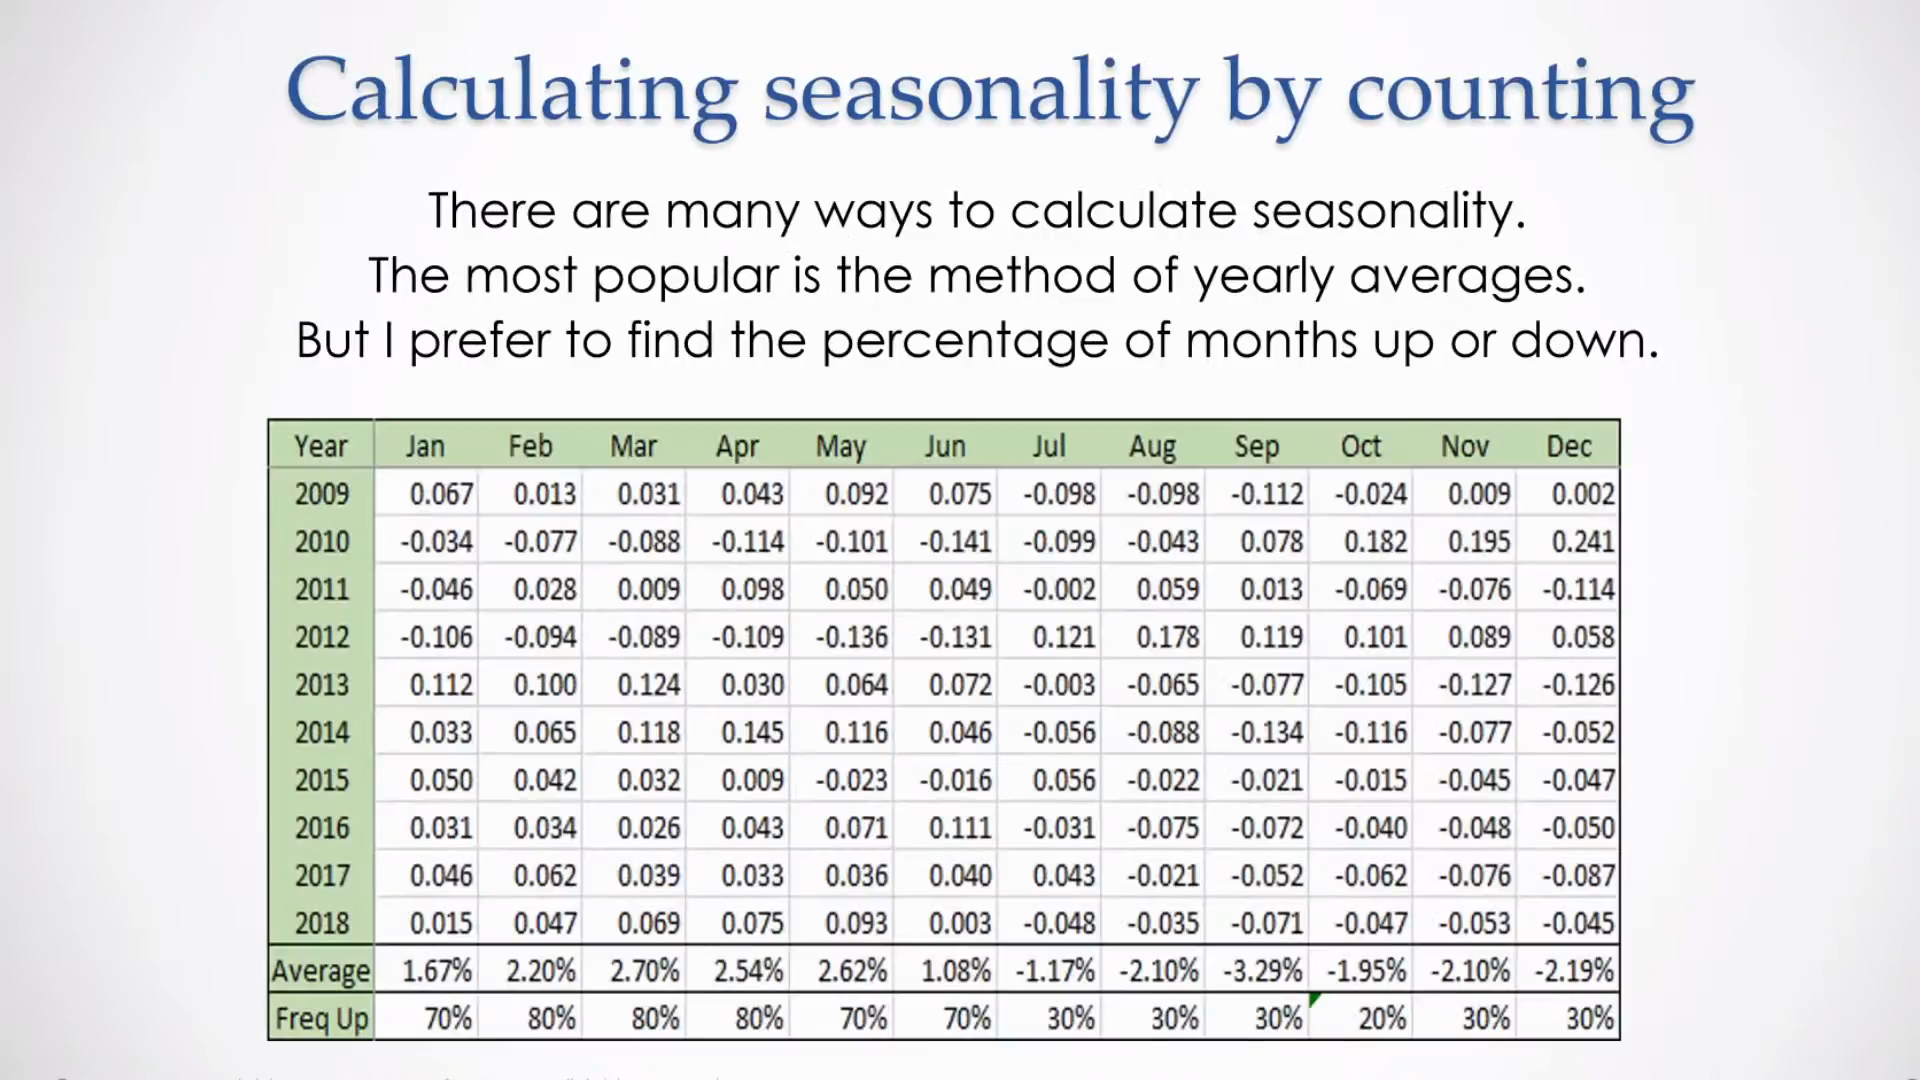 Seasonal patterns - PSE’s seasonal dates framework (solstices, equinoxes, midpoints).
Source: PSE Video
Seasonal patterns - PSE’s seasonal dates framework (solstices, equinoxes, midpoints).
Source: PSE Video
 Seasonality and cycles - how seasonal turning points interact with larger cycles.
Source: PSE Video
Seasonality and cycles - how seasonal turning points interact with larger cycles.
Source: PSE Video
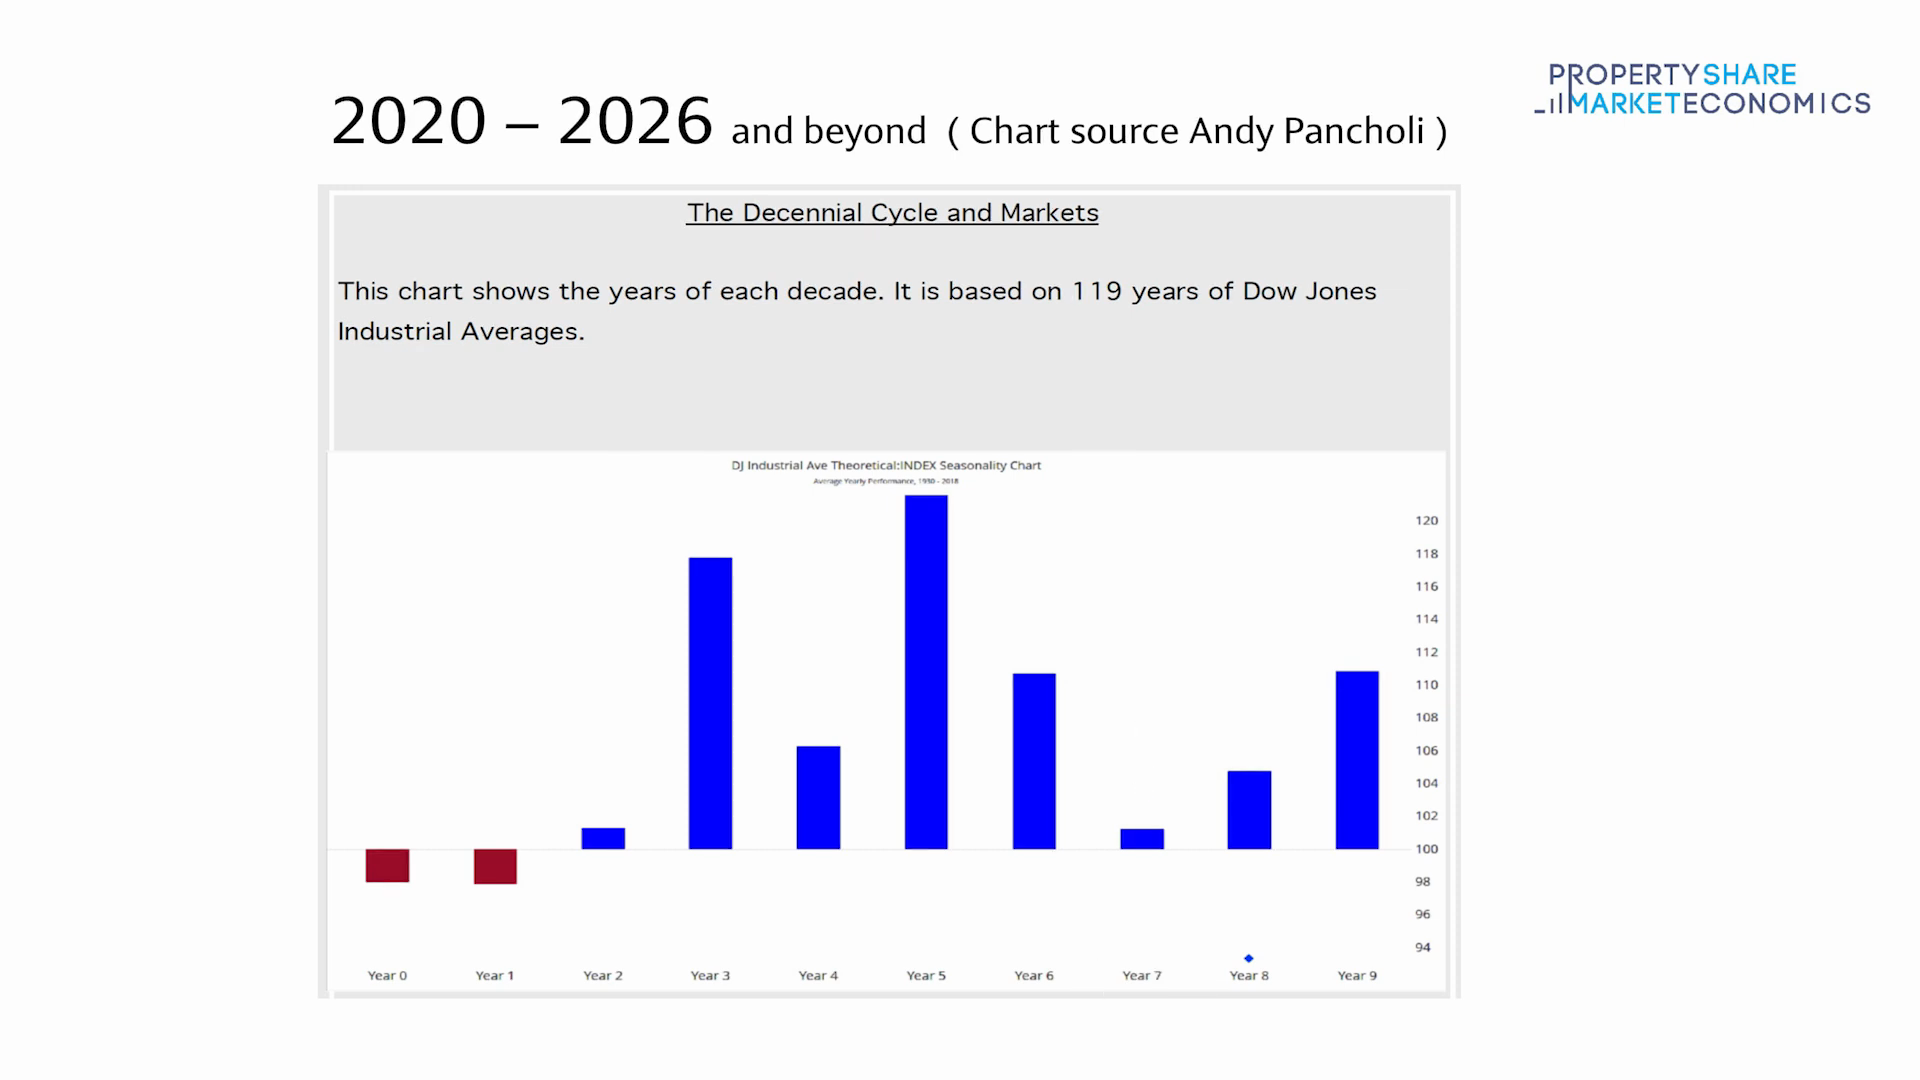 Decennial cycle chart - Dow Jones 10-year repeating pattern used for timing.
Source: 2022-10-01-bbi-gold-coast-session-part-2
Decennial cycle chart - Dow Jones 10-year repeating pattern used for timing.
Source: 2022-10-01-bbi-gold-coast-session-part-2