Mex Pete Trading Style
📸 Visual Gallery — Mex Pete Chart Examples → Textbook annotated examples from Phil Anderson, confirmed setups from Gann emails, and BBB deep dives.
Definition
Mex Pete is an ascending triangle pattern. It is defined as a chart formation with a horizontal resistance line at the top (multiple highs testing the same price level, unable to break through) combined with progressively higher lows forming a rising diagonal support line beneath. The breakout above the horizontal resistance constitutes the buy signal. 12
Primary source: W.D. Gann, Truth of the Stock Tape (1923), page 67 3. Phil Anderson and PSE (Property Share Economics) treat this page as the canonical, authoritative description of the pattern. Anderson explicitly and repeatedly directs subscribers to read this page as foundational to understanding how to trade a bull market 45. PSE hosts a downloadable excerpt of the relevant pages and references it as required reading.
“Read page 67 of Gann’s Truth of the Stock Tape. This is Mex Pete. This is how you trade a bull market.” — Phil Anderson, PSE subscriber email, 10 March 2021
Critical distinction — ascending triangle vs. rising wedge: 2 The pattern is sometimes loosely described as a “rising wedge” or informally as “parallel highs with higher lows forming a diagonal triangle.” The authoritative PSE definition 2 is specifically an ascending triangle:
- Top boundary: Horizontal — flat resistance line connecting multiple price highs at the same level
- Bottom boundary: Rising diagonal — a trendline connecting progressively higher lows
This is distinct from a rising wedge, which has both an upper and lower boundary converging upward (both lines sloping, narrowing toward a point). In a rising wedge, the upper boundary also rises; in the Mex Pete ascending triangle, it is strictly horizontal. The two patterns have different implications and different failure modes. Conflating them is an error.
Name origin: The name “Mex Pete” (or “Mexican Pete”) derives from the specific example W.D. Gann used in Truth of the Stock Tape on page 67 to illustrate the ascending triangle pattern 3. Gann’s original example used a stock called Mexican Petroleum, an oil stock listed on the NYSE in the 1920s 6. PSE adopted the name as shorthand for the entire pattern and trading approach it represents. The name is PSE-community specific; outside PSE circles, traders and technicians refer to the same formation simply as an ascending triangle.
The Pattern — How to Identify It
Visual Structure
Price
  |
  |         ___________Resistance Line (HORIZONTAL)___________
  |        /    \        /    \        /    \        /
  |       /      \      /      \      /      \      /   ← Breakout above here = BUY
  |      /        \    /        \    /        \    /
  |     /          \  /          \  /          \  /
  |    /            \/            \/            /
  |   /                                        /  ← Rising lows trendline (DIAGONAL)
  |__/____________________________________________
                                              Time
Key structural requirements:
-
Horizontal top resistance — The price must have tested the same horizontal resistance level at least two times, preferably three or more. Each test that fails to break above reinforces the resistance line. The highs need not be precisely identical but must cluster at approximately the same price level.
-
Rising lows — Each successive pullback low must be higher than the previous low. This is the defining characteristic that separates an ascending triangle from a rectangle (which has both horizontal support and resistance). The rising lows demonstrate that buyers are becoming more aggressive — willing to buy at progressively higher prices rather than waiting for the price to fall back to prior support.
-
Convergence — Because the top is flat and the bottom is rising, the two boundaries converge toward a point (the apex). The breakout typically occurs before the apex is reached — usually in the first half to two-thirds of the distance to the apex. A breakout attempt very close to the apex, or after it, is a weaker signal.
-
Volume behaviour (confirmatory): Volume typically contracts as the pattern forms (compression) and expands on the breakout above resistance. Declining volume during formation and a volume surge on breakout strengthens the signal. Volume contraction alone does not confirm the pattern; only the price structure matters for identification.
What the Pattern Means Behaviourally
The ascending triangle reflects a specific supply/demand dynamic:
- At resistance (horizontal top): There is a known seller or a pool of sellers at a specific price level. Every time price reaches that level, supply enters and pushes price back. The horizontal line represents a price at which supply has been consistently available.
- At support (rising lows): Each time price pulls back, buyers enter at a higher price than before. The pool of willing sellers at the resistance level is being gradually exhausted — sellers are absorbing bids, but demand is not diminishing. Each pull-back attracts buyers sooner.
- The breakout: When the final sellers at resistance are absorbed, there is no supply remaining at that level. The price breaks above with urgency. The buyers who were positioned in anticipation of the breakout, plus breakout-momentum buyers entering on the break, create a rapid advance. The measured move target (see Entry Rules below) estimates the extent of that advance.
Pattern Timeframe Applicability
The Mex Pete pattern is valid across all timeframes — intraday, daily, weekly, and monthly charts. PSE’s application is primarily on daily and weekly charts for individual stocks and on monthly charts for macro instruments (e.g., US 30-year Treasury Bond Yield, index charts). The reliability of the pattern increases with the timeframe — a weekly ascending triangle is more significant than a daily one; a monthly ascending triangle is more significant still.
Pattern Duration
There is no fixed minimum or maximum duration for a valid Mex Pete setup. However, patterns that have been building for longer periods — months to years — are considered more significant than short-duration patterns, because they imply a larger accumulation of supply being absorbed and a correspondingly larger subsequent move on breakout. Phil Anderson and PSE give particular attention to patterns forming over multiple months or years, especially in the context of the 18.6-year cycle (see below).
Pre-Breakout Invalidation: Loss of Higher Lows
A Mex Pete setup is invalidated before breakout if the stock stops making higher lows. If a pullback drops below the previous swing low — breaking the rising trendline — the ascending triangle structure is destroyed and the stock should be removed from the watchlist. Anderson has applied this explicitly to:
- FG (F&G Annuities): Removed because it was “no longer making higher lows in its setup” (Gann #7, May 2025)
- GOAT (VanEck Wide Moat ETF): Removed because the most recent pullback was “larger than ideal and is invalidating its Mexican Pete setup” (Gann #37, Feb 2026)
- LNG (Cheniere Energy): Removed because it was “weakening and no longer has a valid Mexican Pete pattern” (Gann #25, Nov 2025)
- FCX (Freeport-McMoRan): Entered Jun 4, 2026 on a Mex Pete breakout; stopped out Jun 9, 2026 — a false breakout where price failed to hold above horizontal resistance. Anderson: “FCX looks like a false breakout.” Demonstrates that in late-cycle breadth-challenged environments, even correctly-identified ascending triangle setups can fail if the broader market condition is unfavorable (Gann #16, Jun 2026)
This is the core pre-entry discipline: the pattern itself tells you when to stop watching. If higher lows cease, move on. No discretion required.
Breakout Quality: All-Time Highs vs. Sub-ATH
The highest-conviction Mex Pete setups break out to new all-time highs. When the horizontal resistance is the stock’s all-time high, the breakout leaves zero overhead supply — there are no trapped holders above waiting to sell. This is the ideal configuration.
Anderson explicitly flags setups where the breakout is not at all-time highs as lower reliability:
- LYC (Lynas Rare Earths): “The drawback in the setup is the breakout isn’t at new all-time highs” — framed as a continuation breakout within a longer uptrend, acceptable but weaker (Gann #5, Apr 2025)
- CXDO (Crexendo): Breakout “would not be at new all-time highs, reducing breakout reliability relative to prior additions like XOM and FUEL” (Gann #34, Jan 2026)
- FUEL (BetaShares Global Energy ETF): “Not the most perfect pattern” partly because resistance was from mid-2022 peak, not ATH (Gann #33, Jan 2026)
For agent scanning: Prioritize setups where horizontal resistance equals or is within 2% of the all-time high. Sub-ATH setups should be flagged as lower-confidence candidates.
Entry Rules
Primary Entry: The Breakout
The standard entry is a buy on close above the horizontal resistance line, or a buy stop placed just above resistance to be triggered on an intraday break.
Specific entry discipline per PSE:
- The price must close above the horizontal resistance level, not merely touch or intraday spike above it. A close is required to confirm the breakout is genuine.
- A volume increase on the breakout bar/candle adds confirmation, though it is not mandatory for entry.
- Do not anticipate the breakout by buying inside the pattern. The pattern is only complete — and the signal only valid — once the horizontal resistance is broken.
The 52-Week Highs Connection
PSE’s operational scanning method links Mex Pete identification directly to the daily 52-week highs list. When a stock appears on the 52-week highs list, it is a candidate for Mex Pete review. The logic:
- A stock printing a 52-week high is by definition breaking through a prior resistance level
- This may be exactly the moment the horizontal resistance of an ascending triangle is being penetrated
- Therefore, the 52-week highs list is a daily filter for potential Mex Pete breakouts
This is the mechanism by which PSE’s dedicated scanner identifies candidates. The 52-week high list narrows the universe; the chart review confirms whether the breakout is from an ascending triangle formation or from some other context.
Measured Move Target
The standard measured move (price target) for an ascending triangle breakout is calculated as:
Target = Breakout Level + Height of the Pattern
Where Height of the Pattern = the vertical distance between the horizontal resistance line and the lowest point of the rising lows trendline at the beginning (widest point) of the pattern.
This is the minimum expected move. In strong bull market conditions — particularly those consistent with Phase 2 of the 18.6-year cycle — moves frequently exceed the measured target significantly.
Position Sizing
PSE does not prescribe a single universal position size rule, but the general principle applied is:
- Risk is defined as the distance from entry to the stop-loss level (see Exit / Stop Rules)
- Position size is scaled so that if the stop is hit, the loss represents a predetermined acceptable percentage of portfolio capital
- This is consistent with standard risk-based position sizing; the ascending triangle stop placement (just below the most recent higher low, or below the rising support line) is typically tighter than in less well-defined patterns, allowing for more shares per unit of risk
Exit / Stop Rules
Initial Stop Placement
The initial protective stop is placed below the most recent higher low within the pattern — specifically, below the rising lows trendline. The logic: if the price breaks down through the rising support after breaking above resistance, the ascending triangle has failed. The trade thesis is invalidated.
Operationally:
- Place the stop just below the last swing low visible before the breakout, or
- Place the stop below the rising trendline connecting the sequence of higher lows, measured at the point of entry
The stop should not be placed below the horizontal resistance level (which is now support); that would be too wide and would expose the trader to excessive loss before confirming failure.
Trailing the Stop
Once the trade is profitable and price has moved beyond the measured target, PSE’s general approach (consistent with Gann trend-following principles) is to:
- Move the stop to breakeven once the stock has moved one full pattern-height above the entry
- Subsequently trail the stop using the rising sequence of swing lows on the advancing price — i.e., the same higher-lows principle used to identify the pattern now becomes the exit discipline
- Exit when a significant swing low is violated on the advance, or when a reversal pattern forms at higher prices
Phil Anderson describes this as being “squeezed out” — the trader does nothing intraday; stops are moved only as price makes new highs, and the position is eventually closed by the stop being hit from above, not by the trader making a judgment call at the top. Jesse Livermore identified the psychological challenge here precisely: “The hardest thing to do when the trade goes your way is to sit on your hands and do nothing.” [Source: PSE Gann #11, 2026-05-18; Richard Schmitten, Livermore, World’s Greatest Trader]
Partial Profit Taking
Some PSE practitioners take partial profits at the measured move target (one pattern-height above breakout) and hold the remainder with a trailing stop. This is not universally mandated; it reflects individual risk preference.
Failed Breakout Rule
News at the high: Anderson has observed that significant news coverage or earnings announcements often coincide with short-term highs on the way up — and in some cases with the final top. For LYC (Lynas Rare Earths), there was “a lot of news at that high of 21.50” before the stock was exited. Going forward, Anderson flags this as an additional qualitative signal to consider alongside the mechanical stop discipline: concentrated media attention or earnings releases at elevated prices can be an early warning of peak. This does not override the stop — the stop remains the formal exit — but news concentration at a high adds qualitative weight to taking profits or tightening the stop. [Source: PSE Gann #11, 2026-05-18]
If a stock breaks above resistance, triggers entry, but then falls back below the horizontal resistance line and closes below it, the breakout has failed. This is a stop-loss event regardless of whether the formal stop below the rising lows has been reached. A false breakout followed by a close back inside the pattern is a warning of potential pattern failure and warrants exit or significant position reduction.
Re-Entry Into Pattern = Immediate Exit
“The strongest Mexican Pete breakouts never re-enter the pattern; re-entry is a reliable exit signal.” — Phil Anderson, Gann #40 (Feb 2026), on UMBF (UMB Financial)
This is a harder rule than the general failed-breakout principle above. If after breaking out a stock falls back inside the ascending triangle range — even briefly — the trade is over. Anderson applied this rule to UMBF, which broke out above $121 resistance, re-entered the pattern, and was immediately exited. The logic: a genuine Mex Pete breakout creates a vacuum above resistance as sellers are exhausted; if price can fall back through that level, the supply/demand thesis is invalidated. No waiting for the formal stop — re-entry into the pattern is the stop.
Reverse Mex Pete
Reverse Mex Pete is a descending triangle pattern. It is the mirror image of the standard Mex Pete setup and is a bearish signal.
Structure
Price
  |  ← Breakdown below here = SELL / SHORT
  |    \            /\            /\            /
  |     \          /  \          /  \          /
  |      \        /    \        /    \        /
  |       \      /      \      /      \      /
  |        \____/________\____/________\____/________
  |              Horizontal SUPPORT Line (FLAT)
  |
  |____________________________________________
                                              Time
Key structural requirements:
- Horizontal bottom support — Multiple price lows testing the same price level, failing to break below. The support line is flat/horizontal.
- Declining highs — Each successive rally high is lower than the previous high. Sellers are becoming more aggressive; willing to sell at progressively lower prices. Each bounce attracts sellers sooner than the last.
- Breakdown — When horizontal support is finally breached, it signals that buyers at that level have been exhausted. Price typically falls rapidly toward the measured move target.
Measured Move (Reverse Mex Pete)
Target = Breakdown Level − Height of the Pattern
Where Height = vertical distance between horizontal support and the highest point of the descending highs at the widest point of the pattern.
Applications
The Reverse Mex Pete is applied by PSE in the following contexts:
- Individual stocks — identifying breakdown candidates, potential shorts, or stocks to avoid/exit. James Hardie Industries (JHX) is the canonical 2026 example: a global building-materials supplier whose stock peaked in 2024 and is now — per Phil Anderson (BBI May 27 + Gann #13 May 27 2026) — “making an inverse Mexican Pete.” House builders peak first in PSE’s end-of-cycle sequence (see below); a break of JHX below $17 (support going back to 2022) would confirm the Real Estate Cycle Peak is on track. JHX was added to the Short Watchlist on 2026-05-27. [Source: PSE Gann #13, 2026-05-27; BBI Q&A, 2026-05-27]
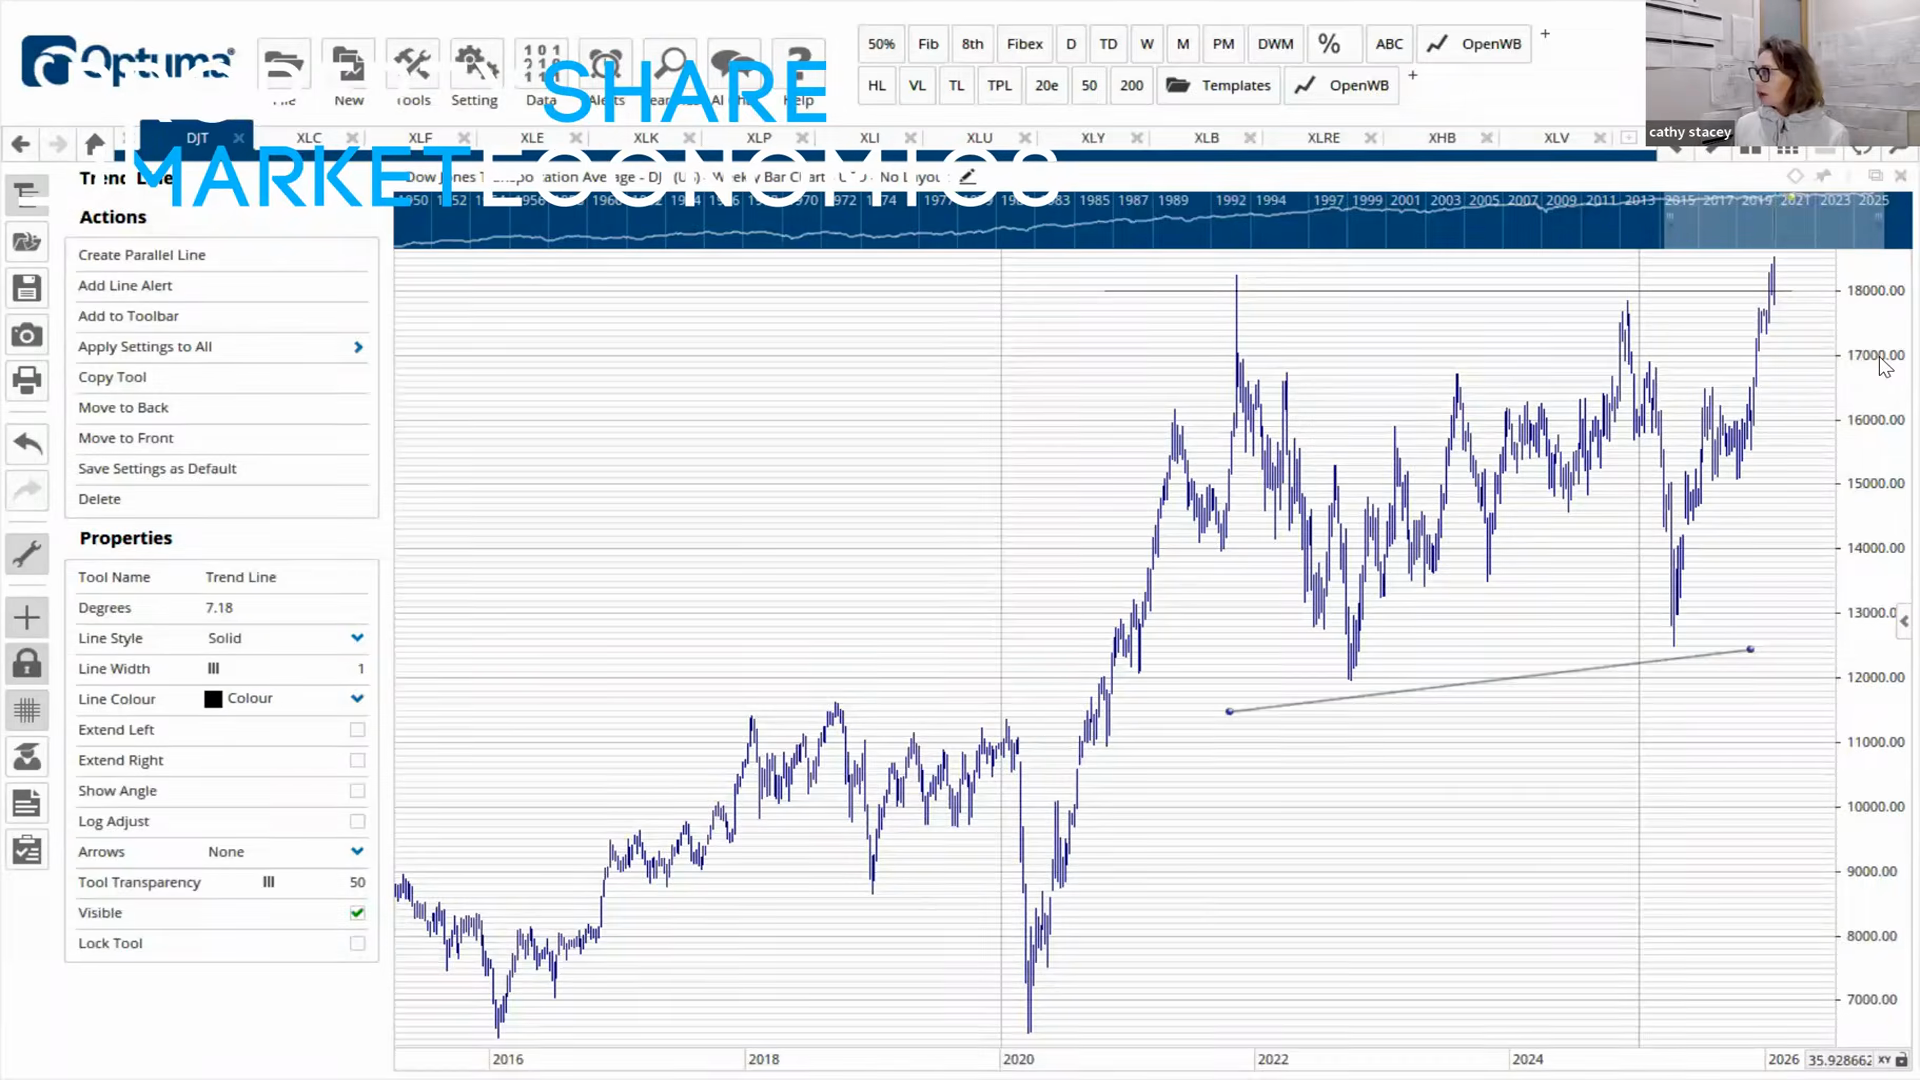
- Bond yields — Cathy Stacey identified the US 30-year Treasury Bond Yield chart (early 2026) as a live Mex Pete (ascending triangle) setup 2, implying a Reverse Mex Pete had been in place during the long bond bull market (declining yield environment). By May 19, 2026, Phil Anderson confirmed the breakout above 5% had occurred and added TBT to the portfolio as a direct trade on this signal. [Source: PSE Gann #12, 2026-05-19]
- Index-level macro analysis — bear market identification at the index level
- End-of-cycle sequencing. Phil Anderson’s commodity-and-equity peak sequence (BBI May 27, 2026, citing Gann emails #24 and #27 from 2025): house builders → copper → gold → silver → oil → usually the market. The pattern-recognition implication is that Reverse Mex Pete setups should now be sought first in house-builder names (JHX is the lead example), then propagate down the chain. A confirmed JHX breakdown is the cycle’s most actionable single-name signal. [Source: BBI Q&A, 2026-05-27]
Reverse Mex Pete Entry (Short)
Entry on a close below horizontal support, with a stop placed just above the most recent declining high or above the descending highs trendline. Mirror image of the standard entry rules.
Scanning Method
The Daily 52-Week Highs List
PSE has institutionalised a dedicated scanning function specifically to identify Mex Pete setups. Per PSE 2: PSE employs a staff member whose role includes scanning the daily 52-week highs list and reviewing charts of stocks appearing on that list for Mex Pete ascending triangle formations 7.
Operational workflow:
Step 1: Run daily 52-week highs scan (end of day or pre-open)
        ↓
Step 2: For each stock appearing on the 52-week highs list,
        pull up the daily and/or weekly chart
        ↓
Step 3: Review chart — does this 52-week high represent:
        (a) A breakout from an ascending triangle (Mex Pete)? → CANDIDATE
        (b) A continuation of an already-running trend? → Monitor
        (c) A random high with no triangular base? → Pass
        ↓
Step 4: If Mex Pete confirmed — check volume, check pattern duration,
        assess measured move target, assess sector context
        ↓
Step 5: If all criteria met — enter per entry rules, set stop,
        log in model portfolio
Why the 52-Week Highs List Works for This Purpose
The logic is self-reinforcing and grounded in the Mex Pete pattern definition:
- A stock making a 52-week high is, almost by definition, breaking above a resistance level that existed at the 52-week high point
- If that prior high was part of a horizontal resistance cluster (the flat top of an ascending triangle), the 52-week high print is the breakout signal
- The 52-week highs list thus automatically surfaces stocks at the precise moment of Mex Pete breakout
- It is an efficient filter because it eliminates all stocks still building the pattern (they have not yet broken out) and focuses attention on the actionable breakout candidates
Additional Scanning Considerations
- Sector context: A Mex Pete breakout in a stock from a sector that is itself in a Mex Pete on the sector index chart is a higher-conviction setup (double confirmation — both individual stock and sector breaking out simultaneously)
- Cycle context: A Mex Pete breakout occurring during Phase 2 of the 18.6-year real estate cycle (the second half of the 14-year up-phase, post-mid-cycle recession) carries greater expected follow-through than one occurring during a cycle downturn
- Market index context: A breakout in
Application Beyond Individual Stocks
The Mex Pete pattern is not limited to individual equities. PSE applies the same ascending triangle framework to:
- Commodities: Gold (spot), copper (LME), silver — commodity prices forming Mex Pete patterns signal cycle-phase commodity rallies. Anderson tracked a multi-year copper Mex Pete from July 2022 through its breakout above $5/lb in 2025, linking it directly to second-half-of-cycle dynamics.
- Commodity ETFs: DBC (Invesco DB Commodity Index), GSG (iShares S&P GSCI), GDX (VanEck Gold Miners), CPER (US Copper Index) — ETFs can form Mex Pete patterns that signal broader sector or asset-class breakouts.
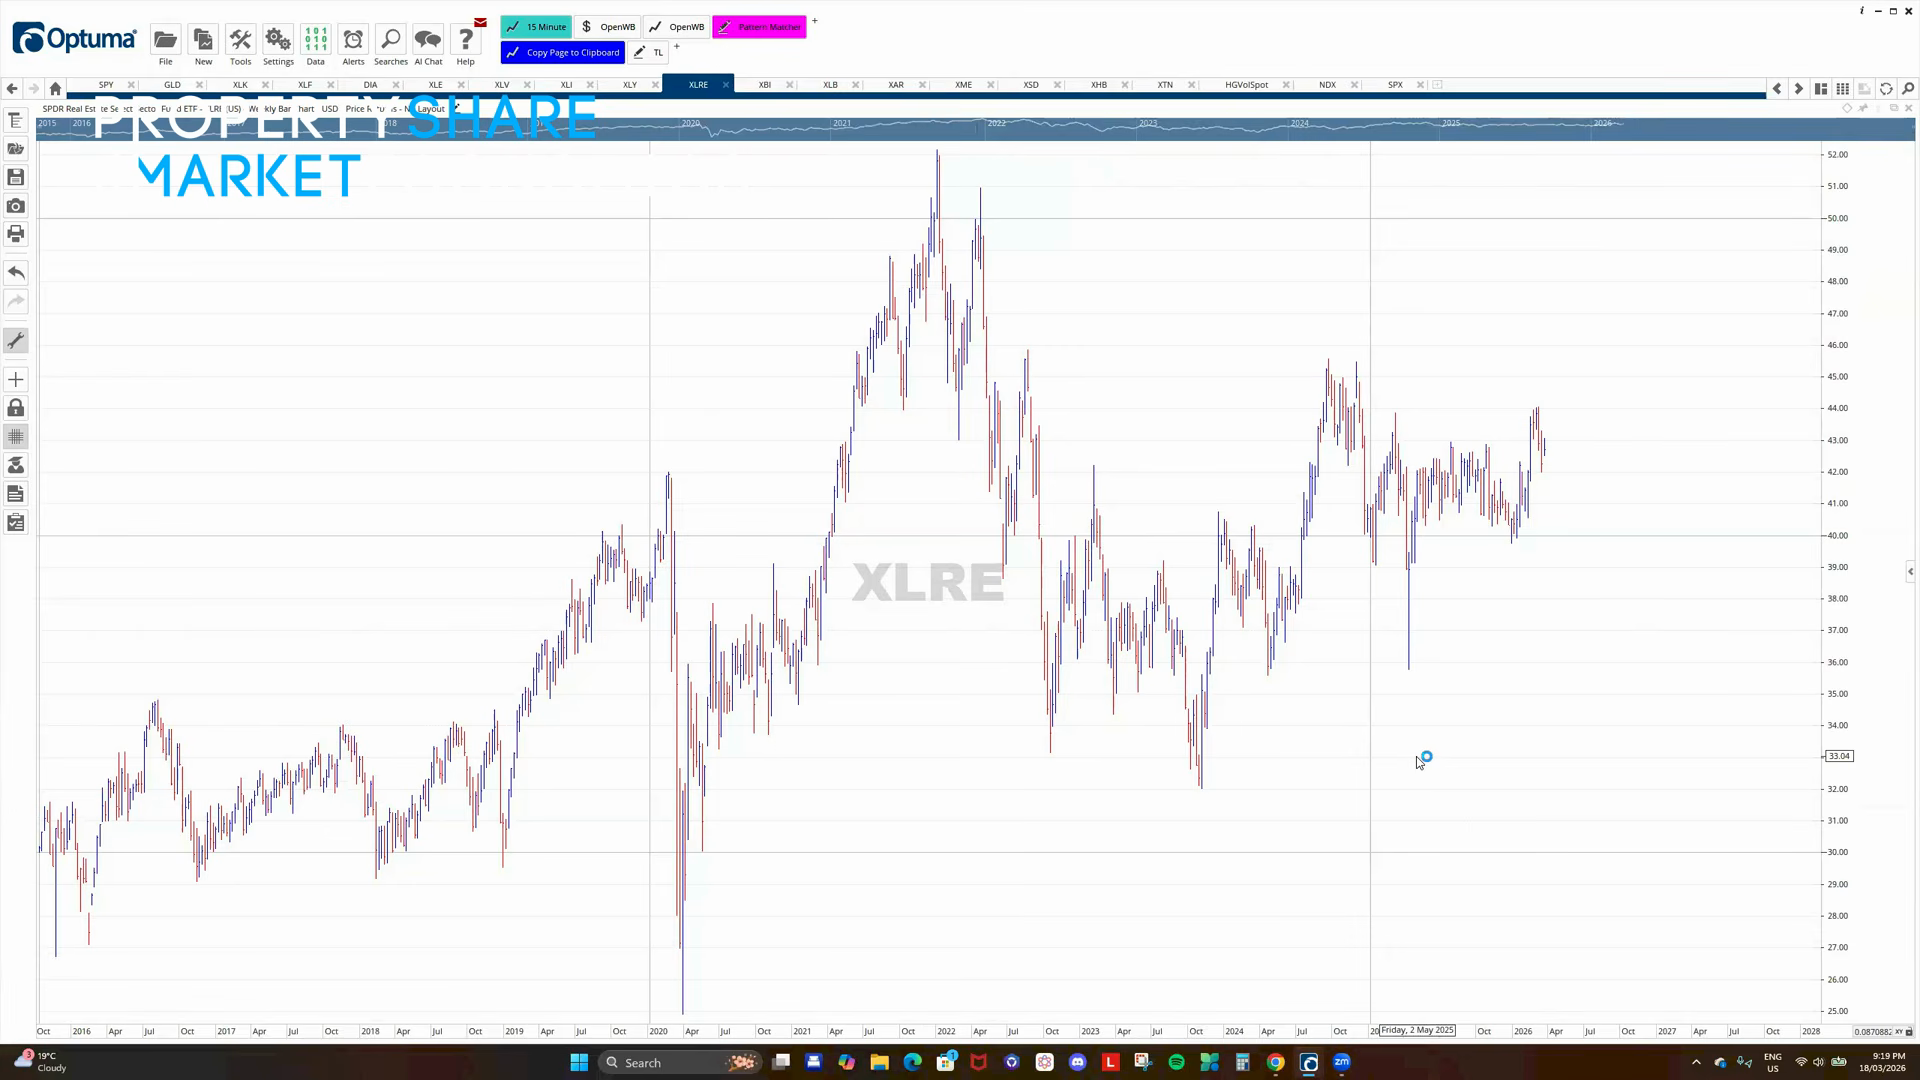
- Sector ETFs: KBE (SPDR S&P Bank ETF), IXC (iShares Global Energy), XHB (S&P Homebuilders) — sector-level Mex Pete breakouts serve as confirmation for individual stock picks within that sector.
- Bond yields: The US 30-year Treasury Bond Yield formed an ascending triangle (Mex Pete) on the monthly chart, identified by PSE as a potential regime-change signal.
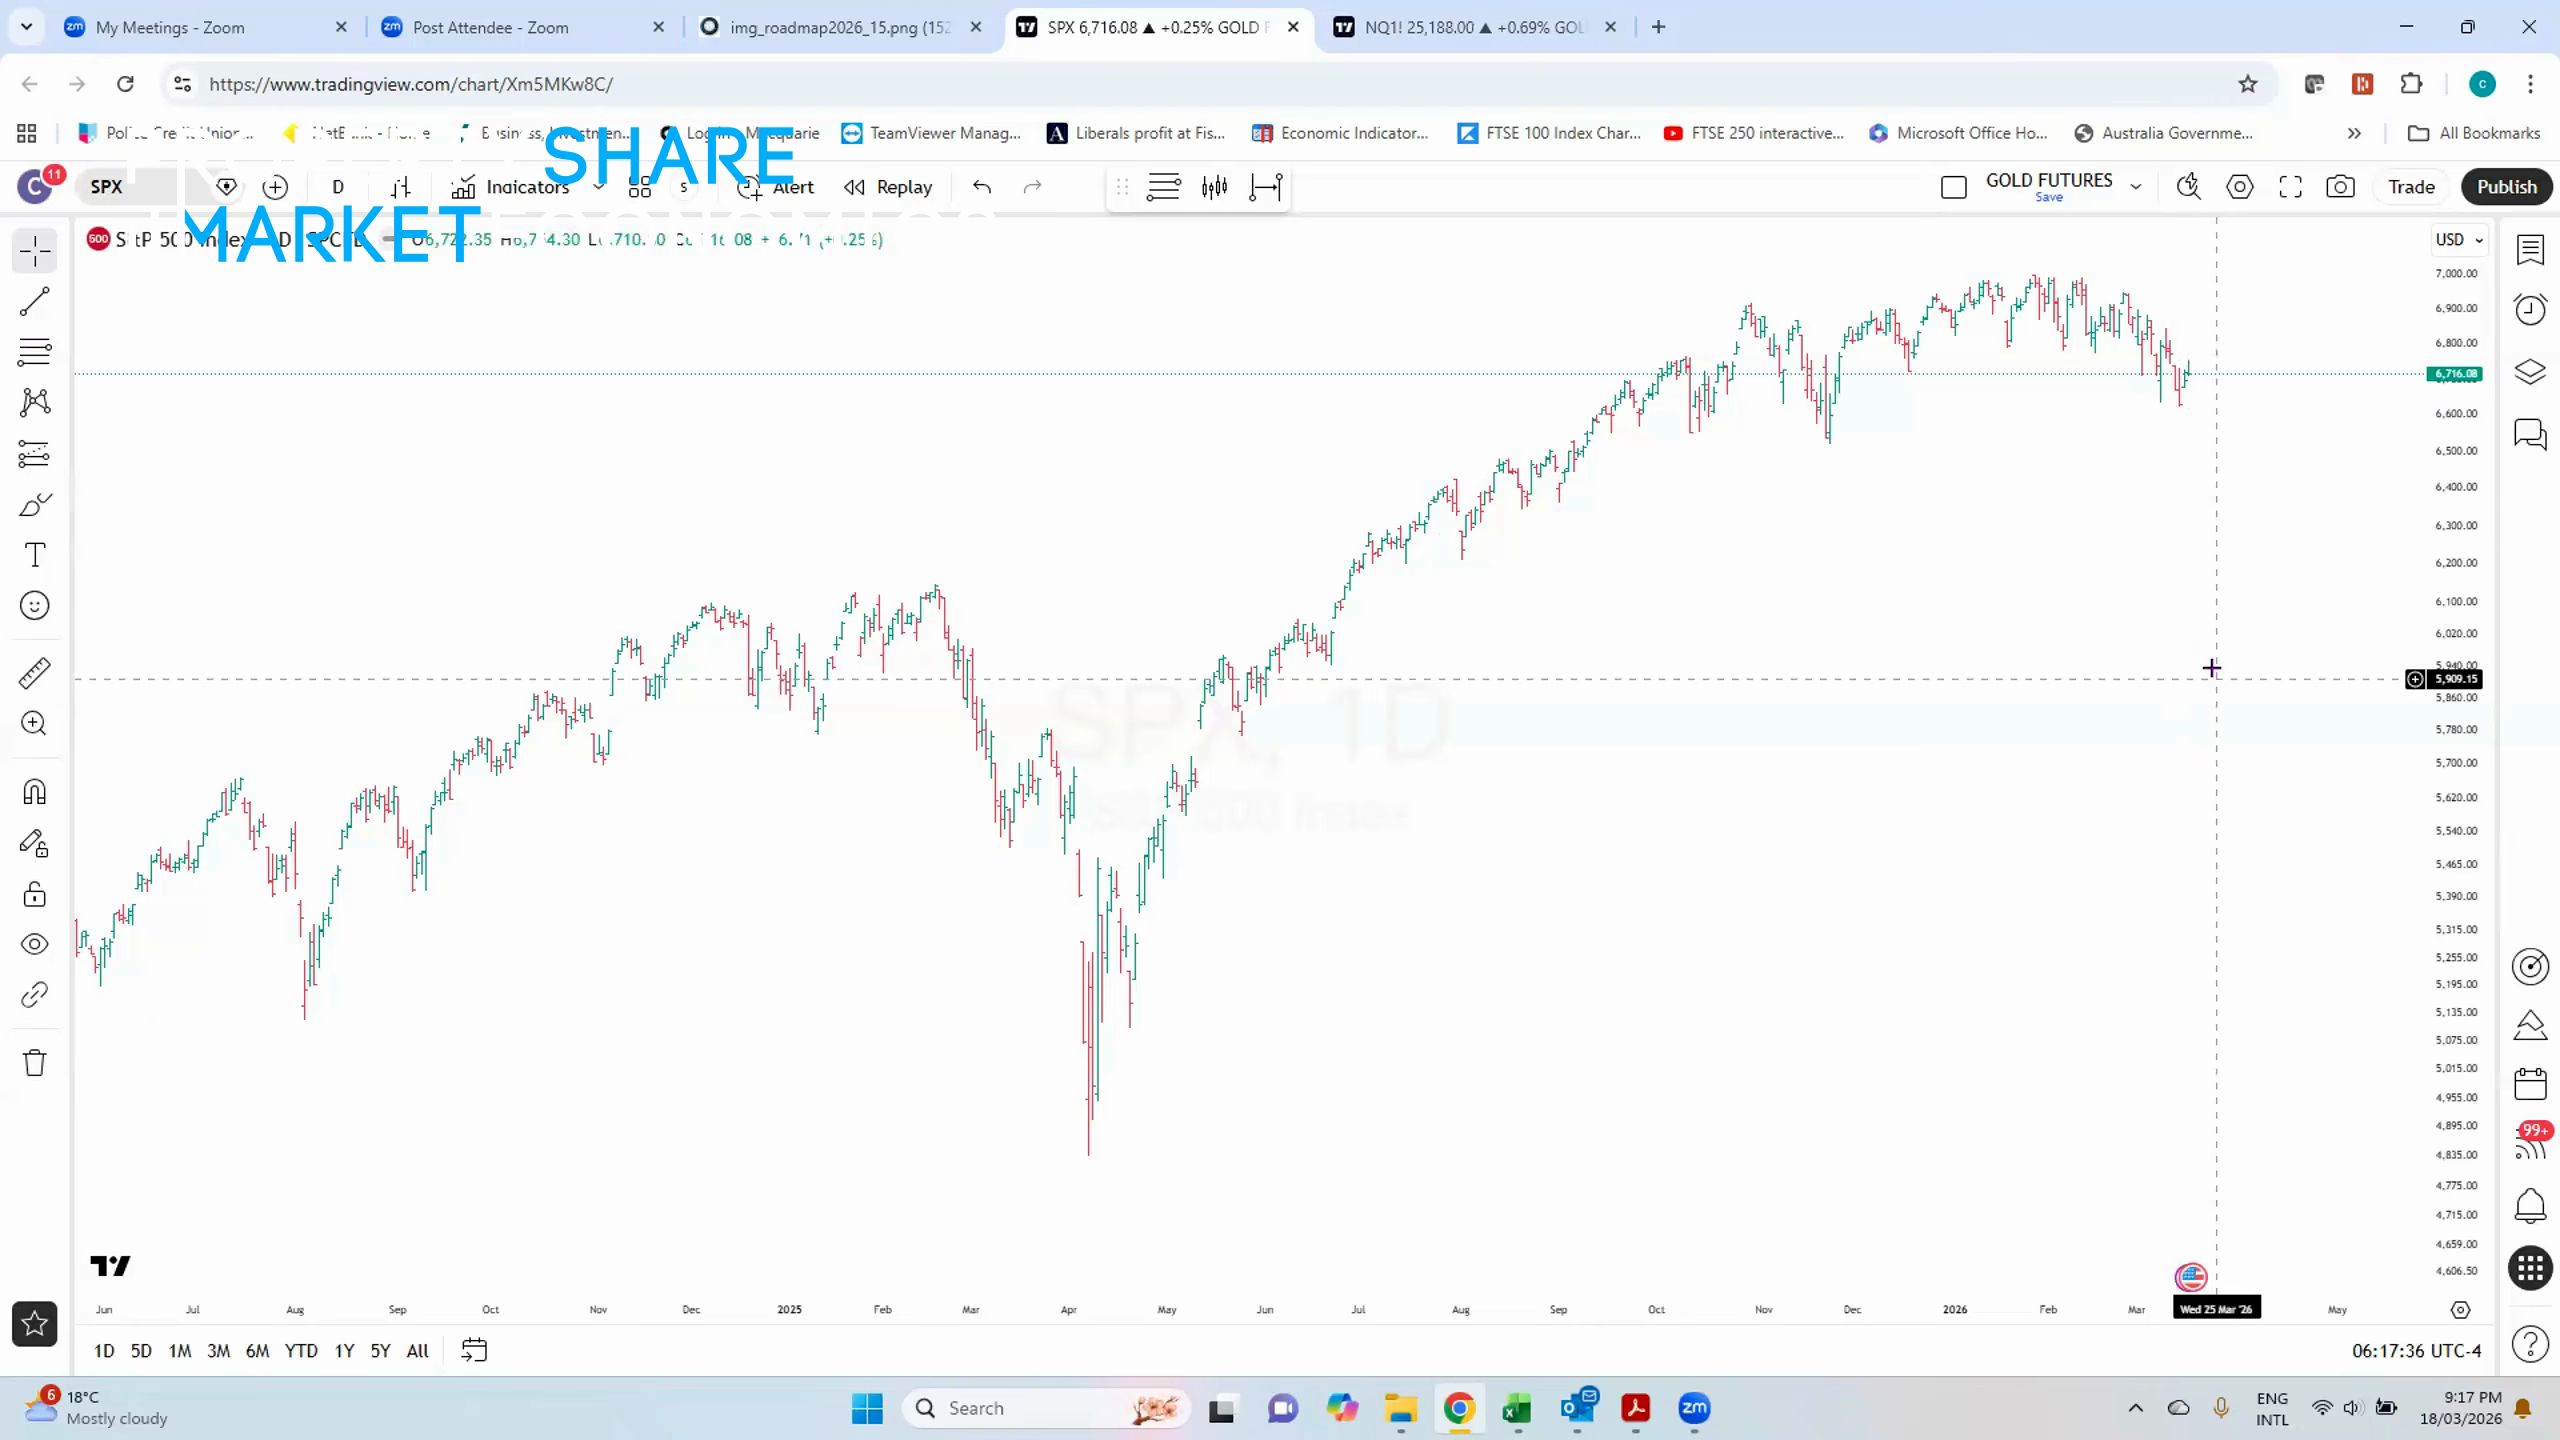
- Market indexes: The ASX 200 weekly chart showed a Mexican Pete formation that resolved in a breakout at end of 2023, slightly ahead of the S&P 500’s move to new highs (Gann #19, Sep 2025).
For agent scanning: When a commodity or sector ETF breaks out from a Mex Pete, scan individual constituents for their own Mex Pete setups — this creates a high-conviction “double Mex Pete” signal.
Key Sources — Ranked by Mex Pete Depth
The following sources contain the most Mex Pete content across the archive. Sources with 8+ mentions typically include specific stock examples, entry/exit analysis, and portfolio updates. These are the highest-value sources for understanding the pattern in practice.
Tier 1: Deep Mex Pete Content (10+ mentions)
| Source | Mentions | Key Content |
|---|---|---|
| Gann #2 Apr 2025 | 16 | Tariffs impact, Mex Pete watchlist updates |
| Gann #35 Jan 2026 | 14 | Commodities breakout, precious metals, Mex Pete updates |
| Gann #19 Sep 2025 | 14 | Mexican Pete breakouts, gold signal, ASX 200 confirmation |
| Gann #39 Feb 2026 | 13 | Mexican Pete patterns, K-shaped economy, portfolio updates |
| Gann #26 Feb 2025 | 12 | Australian watchlist, Mex Pete signals, EVN breakout |
| Gann #28 Dec 2025 | 11 | Stop loss strategy + Mexican Pete application |
| Gann #3 Apr 2025 | 11 | Mex Pete patterns, fund manager underperformance |
| Gann #25 Feb 2025 | 11 | Mania phase signs, RRC addition to Mex Pete portfolio |
| Gann #17 Aug 2025 | 10 | Commodities, REEs, Mexican Pete breakouts |
Tier 2: Significant Mex Pete Content (7-9 mentions)
| Source | Mentions | Key Content |
|---|---|---|
| Gann #38 Feb 2026 | 9 | Cycle rotation, Mexican Pete patterns, stop updates |
| Gann #34 Jan 2026 | 9 | DBC Mexican Pete, CXDO addition |
| Gann #16 Aug 2025 | 9 | Spotting big winners via earnings + Mexican Pete |
| Gann #8 May 2025 | 9 | GMD exit signal, TLC entry (Mex Pete portfolio) |
| Gann #5 Jun 2024 | 9 | Mexican Pete Model Portfolio Launch |
| Mex Pete Definition — Cathy Stacey | 8 | Canonical pattern definition (forwarded by Floyd) |
| WBC Stop Loss Update | 8 | Risk management in practice |
Tier 3: BBB Deep Dives
| Source | Mentions | Key Content |
|---|---|---|
| BBB #13: How to Find Breakouts | 5 | Best educational resource — CALX annotated “MEXICAN PETE PATTERN”, PING breakout, KXI wedge. Has chart images with Phil’s annotations. |
| BBB #53: Guide to Outperform Markets | 5 | CMM “Mexican Petroleum setup”, Gold ascending triangle, GMD breakout |
| BBB #12: Follow the Yield Curve | 4 | Origin story — references Gann’s Truth of the Stock Tape page 67 |
Foundational Source
| Source | Notes |
|---|---|
| Gann #6 Aug 2022: Picking Stocks (I) | Phil’s methodology email — how Gann increased returns, stock selection philosophy |
| Cathy Stacey Definition | Canonical definition — ascending triangle vs rising wedge distinction |
References
1. BBB #13: How to Find Breakouts — Phil Anderson’s educational guide to the Mex Pete pattern with annotated CALX and PING chart examples 2. Mex Pete Definition — Cathy Stacey — Canonical definition distinguishing ascending triangle from rising wedge; forwarded by Floyd (Mar 2026) 3. W.D. Gann, Truth of the Stock Tape (1923), page 67 — original pattern description using Mexican Petroleum 4. Gann Email #09 — Mar 2021 — Phil Anderson: “Read page 67 of Gann’s Truth of the Stock Tape. This is Mex Pete.” 5. Gann #6 Aug 2022: Picking Stocks (I) — Phil’s stock selection methodology email 6. BBB #12: Follow the Yield Curve — Origin story: Gann’s Mexican Petroleum example explained 7. Gann #5 Jun 2024 — Mexican Pete Model Portfolio launch; operational scanning workflow described 8. BBB #53: Guide to Outperform Markets — Real-world CMM “Mexican Petroleum setup” example with annotated charts 9. Gann #19 Sep 2025 — Mexican Pete breakouts in practice: gold signal, ASX 200 confirmation 10. Gann #28 Dec 2025 — Stop loss strategy and Mexican Pete risk management application
Visual Evidence from Video Slides
These slides from PSE video content show stock charts that demonstrate ascending triangle / Mex Pete patterns in practice.
For the full curated image gallery with BBB course images, see mex-pete-gallery.
 Stock chart with trendlines — ascending triangle trendlines illustrating Mex Pete accumulation.
Source: 2026-01-22-bbi-january-2026
Stock chart with trendlines — ascending triangle trendlines illustrating Mex Pete accumulation.
Source: 2026-01-22-bbi-january-2026
 Stock market trend chart — showing the rising-lows pattern characteristic of Mex Pete.
Source: PSE Video
Stock market trend chart — showing the rising-lows pattern characteristic of Mex Pete.
Source: PSE Video
 Detailed stock chart — price action with support/resistance used in breakout analysis.
Source: PSE Video
Detailed stock chart — price action with support/resistance used in breakout analysis.
Source: PSE Video
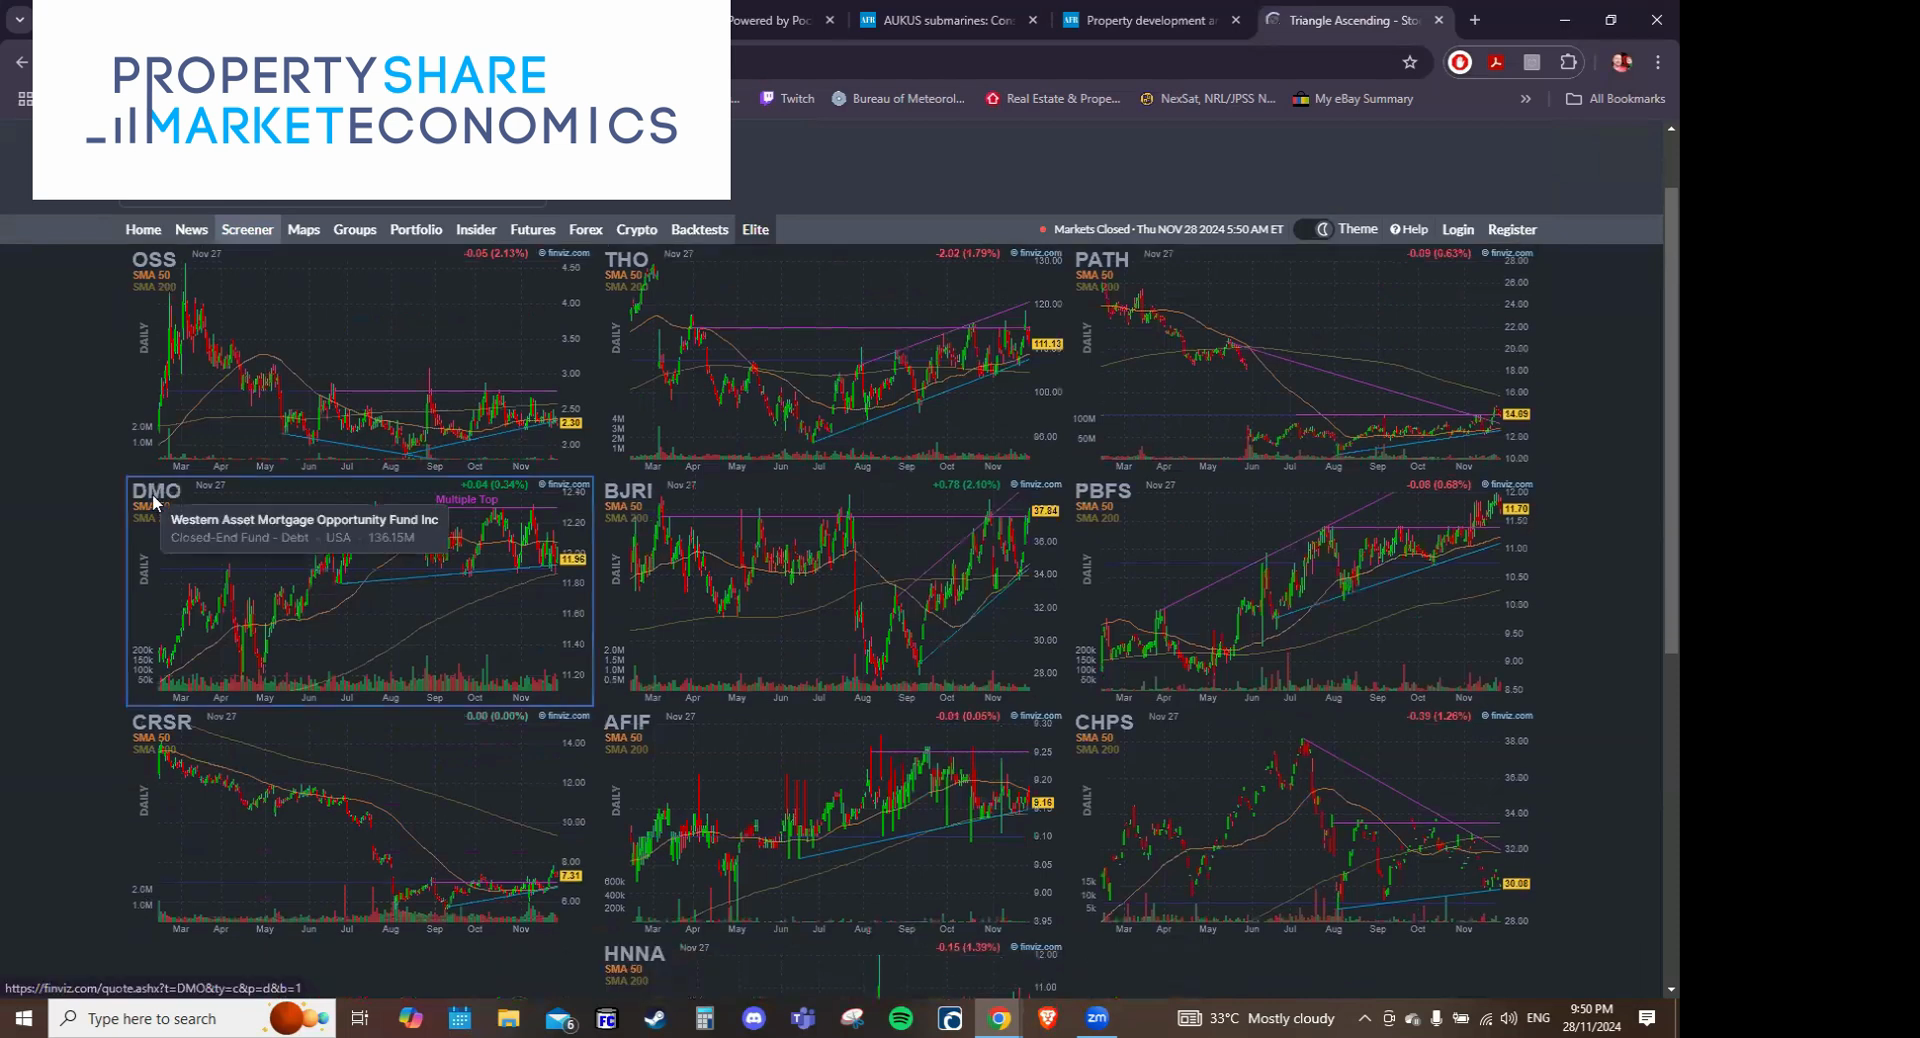 Multiple candlestick charts — showing various stock setups for pattern comparison.
Source: PSE Video
Multiple candlestick charts — showing various stock setups for pattern comparison.
Source: PSE Video
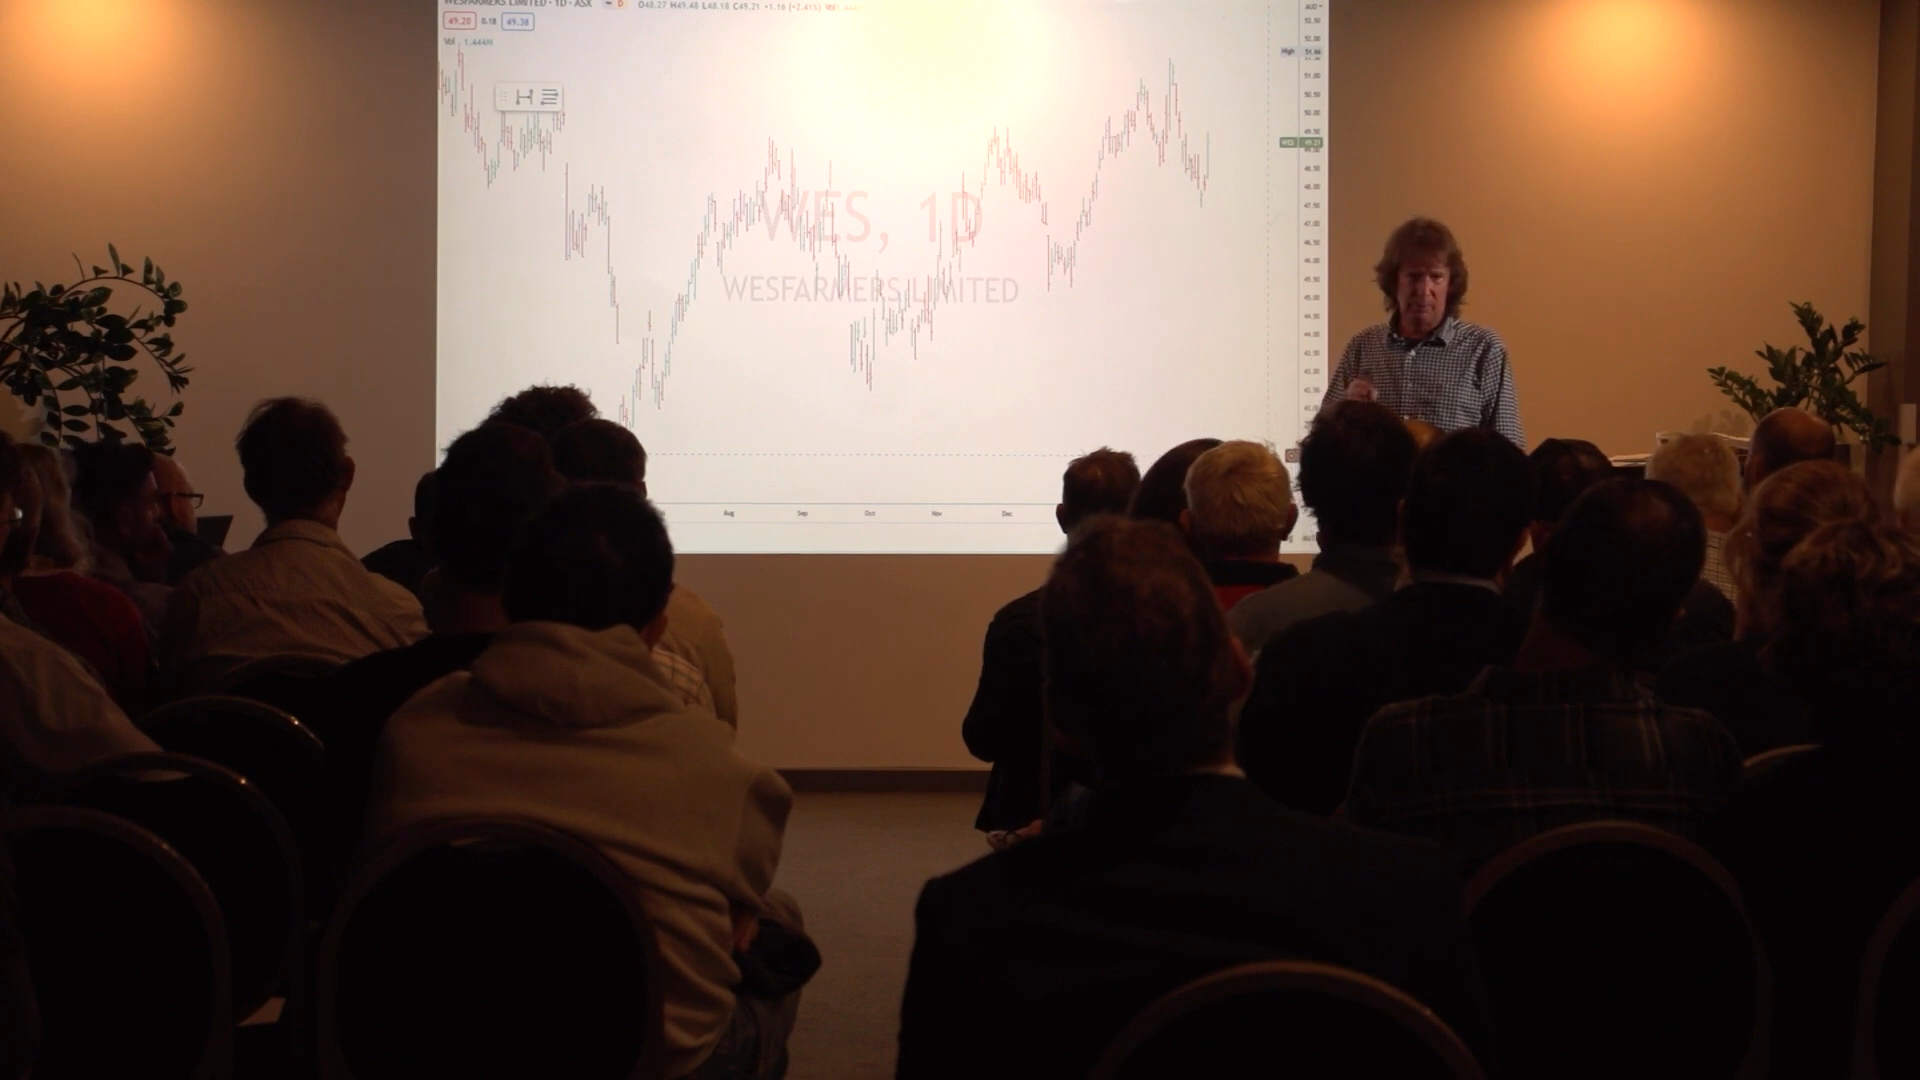 Wesfarmers (ASX: WES) — Australian stock chart analyzed in PSE context.
Source: PSE Video
Wesfarmers (ASX: WES) — Australian stock chart analyzed in PSE context.
Source: PSE Video
 Westpac Banking Corp (WBC) — stock chart example from PSE Australian analysis.
Source: PSE Video
Westpac Banking Corp (WBC) — stock chart example from PSE Australian analysis.
Source: PSE Video
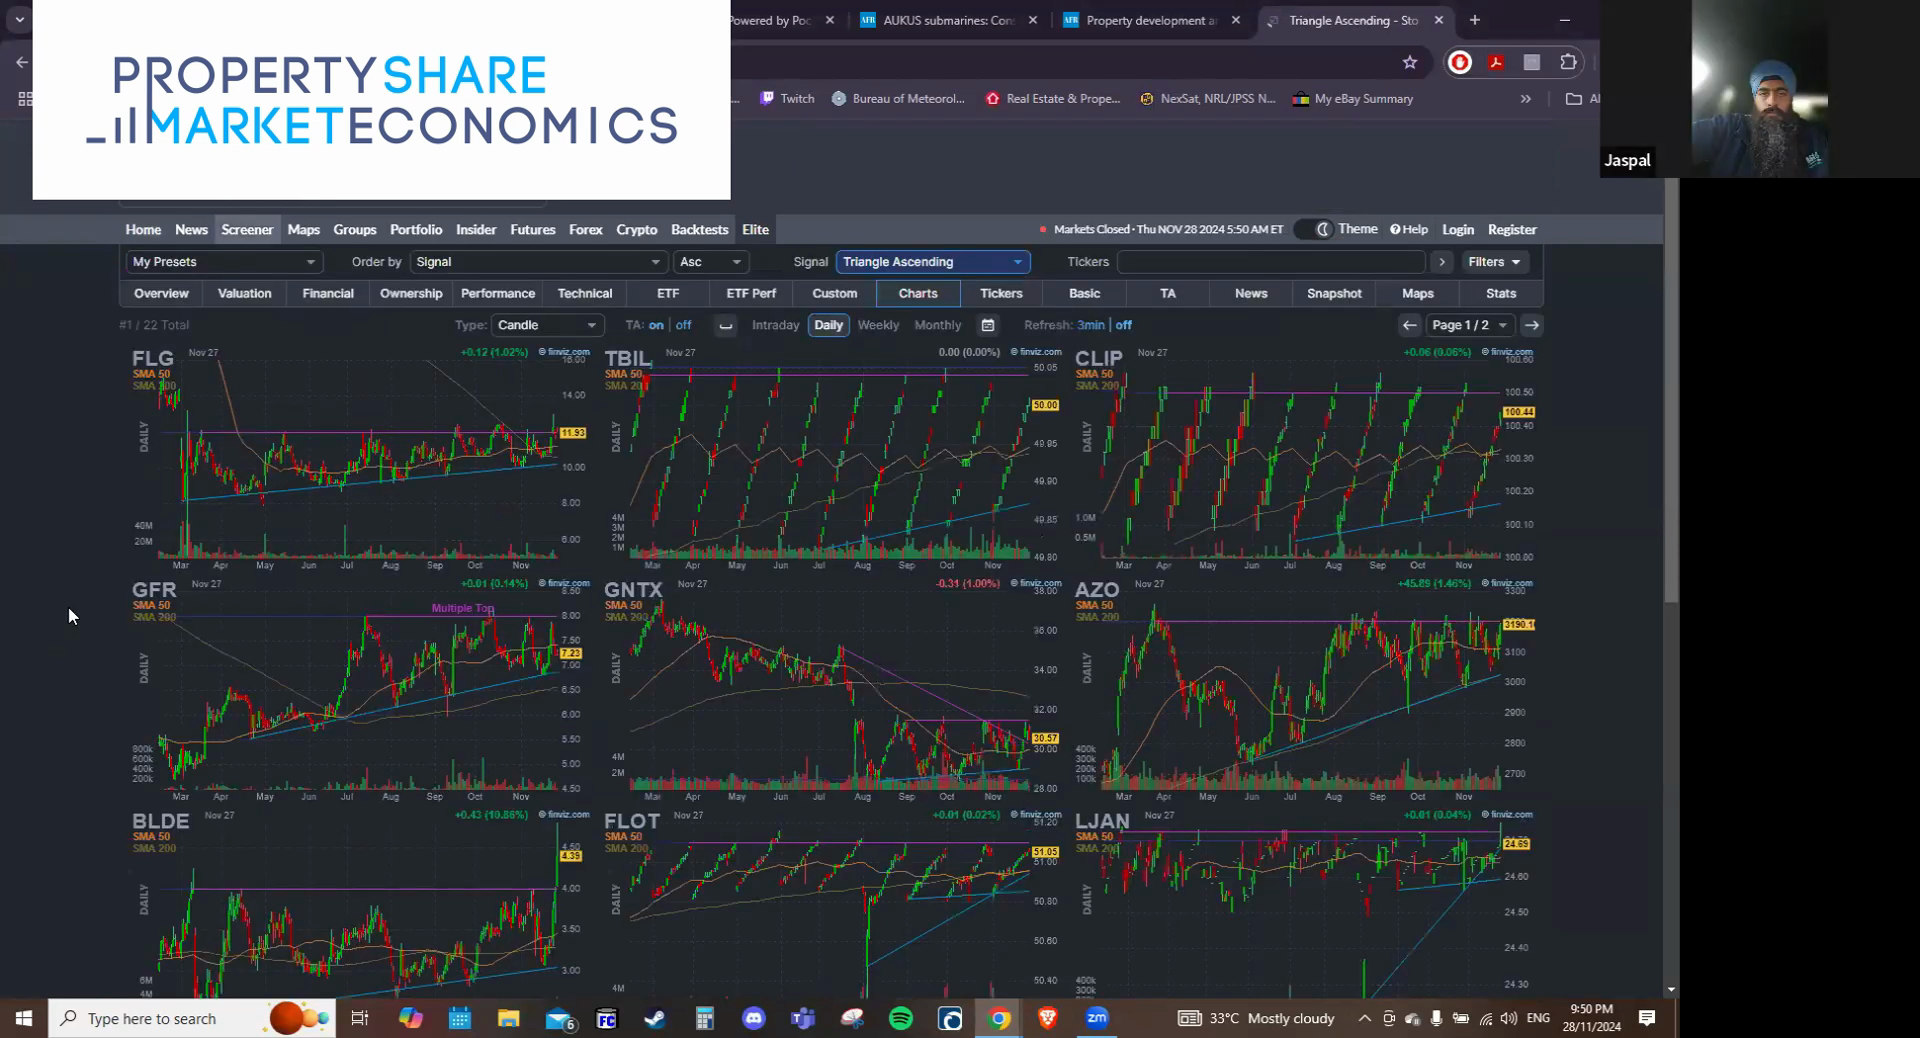 Market screener — screening for ascending triangle breakout candidates.
Source: PSE Video
Market screener — screening for ascending triangle breakout candidates.
Source: PSE Video
Live Portfolio Snapshots (2026)
These model portfolio PDFs document PSE’s Mex Pete positions in real time, providing ground-truth data on entry/exit discipline, stop management, and sector rotation in the late-cycle environment.
June 9, 2026 Portfolio — Full Source Page
Active positions as of June 9, 2026:
- FUEL (BetaShares Global Energy, AU) — in Jan 16, 2026 @ 6.97; current price 8.67 (+24.4%); stop at 6.50
- XOM (Exxon Mobil, US) — in Jan 16, 2026 @ 129.13; current price 151.75 (+17.5%); stop at 144 (raised Mar 17)
- TBT (ProShares UltraShort 20+ Year Treasury, US) — in May 18, 2026 @ 37.50; current price 36.50; stop at $34
- YPF (YPF S.A., Argentinian energy, US-listed) — in Jun 2, 2026 @ 54.74; current price 53.54 (~flat); stop at $43
- CMG (Chipotle Mexican Grill, US) — short from Jun 4, 2026 @ 28.74; current price 29.27; stop at $33
Recent exits:
- FCX (Freeport-McMoRan) — entered Jun 4, 2026 @ 70.64; stopped Jun 9, 2026 @ 63.91 → −$6.73/unit (false breakout). Anderson: “The action in FCX also shows that buying breakouts remains tough with many sectors outside of semiconductors struggling for traction.” [Source: PSE Gann #16, 2026-06-09]
- DBA (Invesco DB Agriculture Fund, US) — in Mar 10, 2026 @ 26.55; stopped May 29, 2026 @ 27.25 → +29
- GLD (SPDR Gold Shares) — in Sep 9, 2025 @ 334.70; stopped Mar 23, 2026 @ 426.41 → +91.71 per unit (largest portfolio win)
- KBE (S&P Bank ETF) — stopped Mar 9, 2026 (−7.70); banking stress confirming private credit thesis
- UMBF (UMB Financial) — stopped Feb 25, 2026 (−14.24); early banking canary
- CNX (CNX Resources, natural gas) — stopped Apr 22, 2026 (−4.02)
Pattern (June 9): PSE explicitly shifting attention toward the Short Watchlist as long Mex Pete breakouts become scarcer outside AI/semiconductor names. The FCX false breakout confirms copper miners — despite strong narratives — are not sustaining breakouts under current breadth conditions. Late-June solstice weakness (per forecast curves) creates a tactical window favoring short entries over new longs. Short Watchlist now 8 names: RH, ITB, APP, PLTR, HD, COIN, JHX, MSTR. [Source: Mex Pete Model Portfolio PDF, PSE, 2026-06-09; PSE Gann #16, 2026-06-09]